
Is a stock market rally coming? I think that is most likely the case. We recommend using that rally to rebalance portfolio risks, as we could see more corrective action in the historically weak month of September, suggests Lance Roberts, editor of Bull Bear Report.
To understand why I’m looking for a bounce, consider what we said at the beginning of July in “Complacency Seems Overly Complacent”:
“With bullish optimism quickly returning to the market, the pressure to chase performance from the ‘Fear Of Missing Out’ will continue to provide a bid under stocks. However, such does not remove the potential for a 5-10% correction. Such corrections are normal within any given year and will provide the best entry point to increase equity exposure near term.”
Sure enough, since the beginning of August, the stock market has come under pressure. Concerns about higher interest rates, a downgrade of US bonds, and an uptick in inflation spooked more bullish investors. The market has declined by roughly 5% from the recent peak through the end of last week.
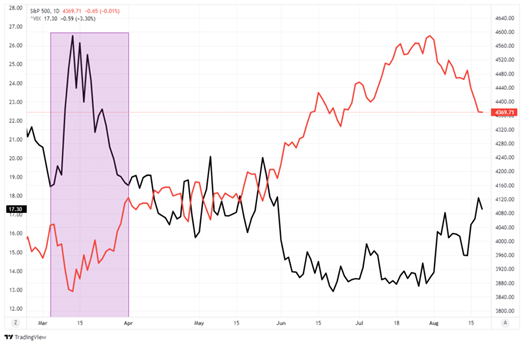
Notably, the correction was orderly, with no signs of financial stress. The following chart shows that volatility (as measured by the VIX, shown in black) did rise somewhat when the stock market (the S&P 500, shown in red) declined.
However, during periods of “stress,” the volatility index tends to “spike” higher. You can see the difference between the current decline and March during the regional bank failures.
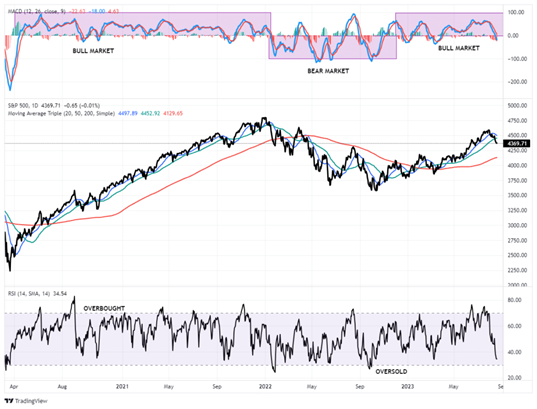
After two weeks of consistent selling pressure, the previous overbought and more exuberant sentiment levels have reversed. During more bullish market trends, technical indicators tend to bottom at more shallow levels.
The chart below shows the Moving Average Convergence Divergence indicator (MACD), which measures the spread between two moving averages. Crosses of the two lines denote “buy” or “sell” signals for the stock market. Furthermore, the Relative Strength Index (RSI) has also reversed from above 70 to near 30. Such levels are often associated with short-term stock market bottoms.
The data in this past week’s Bull Bear Report also supports the reflexive rally thesis. First, most major markets and sectors reached more extreme short-term oversold levels and are off recent highs. While there could be some additional selling pressure near-term, generally, a bounce occurs when most markets and sectors are nearing more oversold levels.
Secondly, analysis of market and sector performance relative to the broad market also provided clues. That analysis, which measures historical volatility, generates risk ranges we can use to determine optimal entry and exit points.
Most markets and sectors are trading well below their normal risk ranges. Historically, when corrective periods have been very broad, as we have seen since the beginning of August, such usually provides a reflexive rally. This analysis suggests a bounce over the next week or so.


