Veteran trader Greg Capra of Pristine Capital Holdings, Inc. details some of the basics of what to look for when trading a gap, so that the odds are in your favor.
Gaps occur every day to varying degrees on stocks and indices. To the stock trader, these gaps can offer enough trading opportunities to be done trading by mid-morning and many are. That being said, these gappers, depending how they have gapped, can provide additional trade setups later in the day, as well as in the coming days. In this article, we'll review two gaps and a strategy how to have played them, use in the future and why they should continue the move.
As I mentioned, gaps occur in varying degrees. Those gaps also can be in the direction of the prior day's movement or against them. With the prior days of movement, the gap can be a continuation (pro) type of gap or it can be an exhaustion (novice) type of gap. The difference is based on whether the gap occurred after some type of correction within a trend, e.g., a gap up after a pullback or a consolidation base within an uptrend. The exhaustion gap occurs after prices have been trending in one direction for a period of time and then prices gap in that direction.
All price movement reflects traders' and investors' beliefs and emotions; however, gaps can provide a shock element to price movement when the gap is against the recent price direction. Those educated and experienced trading gaps aren't shocked by continuation and exhaustion gaps, since they are expected based on the existing trend, location of support, resistance and pattern of candles. When prices gap in the opposite direction of the current pattern that partially or completely reverse the direction of the prior bar or two, it's a shock. The larger the immediate candle before the gap and the size of gap against it, the greater the shock and potential opportunity to profit. Let's look at two.
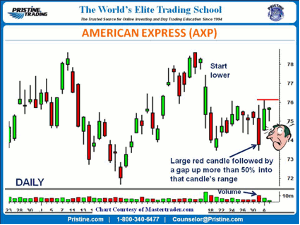
American Express (AXP) had started to move lower with a large gap down, slightly recovered, stalled and then broke lower and closed with a huge red candle that closed near the low of the day. That day also occurred with an increase in volume. The pattern was pointing toward AXP moving lower, but that didn't happen. Rather, AXP gapped up the next day more than 50% into the prior red candle's range! Gaps like this shock traders since the prior pattern did not suggest such a large move in the opposite direct. We can correctly assume that traders are short were expecting AXP to move lower based on the pattern. What do you think they are going to do if AXP doesn't immediately collapse lower? This is what sets up a "gap and go" type of morning for stock traders to take advantage of. If AXP can move higher above the high (red line), it should continue moving up. But let's look at the intra-day chart that day and how it setup.
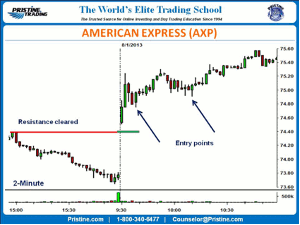
On the gap up, AXP cleared its resistance area, but the gap higher also leaves a partial void of support that has the potential to be filled. For that reason, entering long immediately could result in a move lower and without a clear area to place a stop-loss. What to do? Let AXP form a price pattern signaling that buyers are stepping up and taking control again in the form a reversal pattern. These patterns can happen in many ways, but the trained trader will follow bar by bar and see whatever the pattern is as it unfolds. The odds are AXP will move up based on the daily shock setup.
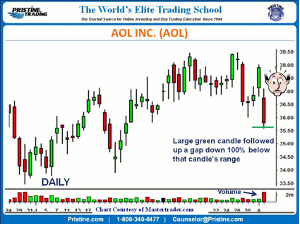
AOL Inc. (AOL) is another example of a gap and shock. AOL was moving up toward resistance, but had closed strong the near the day's high and with an expanding range. The next day AOL gapped under that large green daily bar. What are all the traders that bought AOL that day now holding or anyone that bought in the prior two weeks? Right, losses! What would you do if you were long? Cut and run? Hope it comes back to get even? Buy more? The last two choices typically don't work out very well. No one likes losing, but it happens. Professional traders and investors have a plan that includes a stop-loss and stick to it.
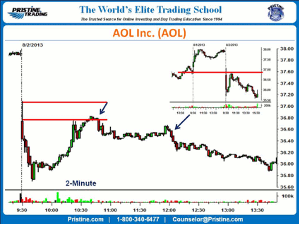
A gap lower under a large daily green candle strongly signals that prices will go lower, but gaps create voids and the intra-day entry must be formed. Here I have included the15-minute chart to see why prices stalled moving higher; the resistance (supply) to the left. The two-minute detail provides the pattern signaling the setup on the current day in alignment with the big picture.
These are some of the basics of what to look for when trading a gap. Look for daily shocks, prior areas of support or resistance where traders will take positions, and a current pattern that forms in alignment with the big picture analysis. The odds will be in your side.
By Greg Capra, President & CEO, Pristine Capital Holdings, Inc.


