
MoneyShow's Tom Aspray explains why the strong February was not a surprise and notes that if it can hold its current gains until the end of the month, it would be the best February since 1998. With many already looking ahead to March, Tom also shares his thoughts on what investors and traders should expect next month.
The S&P 500 started last week at new all time highs, and despite the prevailing skepticism, it continued to make further new highs as the week progressed. Even though the NYSE Composite has not yet made new highs, the daily NYSE Advance/Decline broke out to a new high on February 3 and convinced me the next day that stocks did have enough juice to breakout to the upside.
Despite the many positive technical readings for the stock market, there are no signs yet that prices are ready to accelerate to the upside. Stocks had been ready for a pullback last week and the selling early Friday, if it continues into the close, could be the start of a welcome pullback. Stronger signals could develop by early March and I continue to think that stocks have the ability to melt up in 2015.
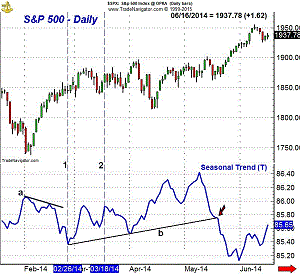
After January's lower close, the strong action so far in February has not been surprising. The January 2014 S&P decline of 3.43% was followed by a 4.31% gain in February. As of the close on Thursday, February 19, the S&P 500 was up 5.1% for the month. If the S&P can maintain these gains through the end of the month, it would be the best February since 1998 when the S&P was up 7.04%.
Click to Enlarge
Since 2010, the S&P 500 has been higher every February and only in 2011 was it followed by a lower close in March as it was down 0.21%. The seasonal chart of the S&P 500, that is based on data going back to the 1930s, shows that it typically declines (line a) from Valentine's Day until February 26 (line 1).
The S&P 500 then generally rallies until March 18, which in 2015, translates
to fourteen trading days. Of course, the November to May period is the seasonally
best time for stocks as the seasonal trend peaks on May 8. The uptrend from
the lows (line b) is then broken on May 19.
Click to Enlarge
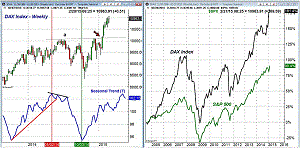
The German Dax has once again led the US market higher in 2015 as it broke out to new highs in the middle of January as resistance at line a, was overcome. The projected chart targets for the Dax are in the 11,800-12,200 area.
The seasonal analysis for the Dax shows that it typically tops in early May and then turns lower, line b. The uptrend, line a, is broken in the middle of June. In comparing the Dax Index and the S&P 500 since the bear market low in 2009, one can see that Dax has been the strongest performer by a significant margin.
It rose from the zero line to +181.4% last week. The S&P was down -25%
in 2009 and is currently up 90.4% for a total gain of over 115%. As I noted
last week in European
ETFs on Sale, I am looking for a drop to set up a buying opportunity
in two euro-focused ETFs.
Click to Enlarge
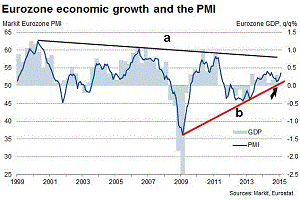
Despite the lack of any solution to the Greek debt problem as we move closer to the deadline, there has been some encouraging news out of the EuroZone. In the latest data, the EuroZone PMI hit a five month high, which is consistent with a positive 1st quarter GDP. The chart shows that the PMI has turned up from support at line b. A move through the downtrend, line a, would provide strong evidence that their economy had turned the corner.
The data last week on US manufacturing continued to show a slightly slowdown as the Empire State Manufacturing Survey showed a slight decrease from January's report. The Industrial Production came in positive at 0.2% but was below the consensus estimate. The Philadelphia Fed Survey was also a bit lower at 5.3 versus January's 6.3, which does indicates a less optimism environment.
The Leading Economic Indicator was updated for January last Thursday and came
in at 0.2% as December was revised downward to 0.4%. It is one of my favorite
economic indicators that is composed of ten economic indicators and historically
tops out well ahead of the economy.
NEXT PAGE: What to Watch
|pagebreak|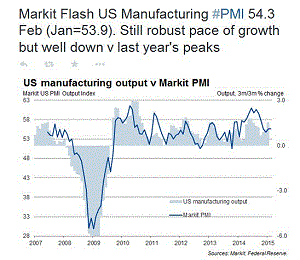
Click to Enlarge
Last Friday, the Markit Flash US Manufacturing PMI came in better than expected at 54.3. This, according to Markit, indicates a "robust pace of growth." It is down from last year. The production volumes were strong as they hit a four month high, while employment and new business continue to show some weakness.
Monday we get the PMI Services Index, Existing Home Sales, and the Chicago Purchasing Managers Index. This is followed on Tuesday by the S&P Case-Shiller HPI, Consumer Confidence, and Janet Yellen begins her testimony to the Senate Banking Committee.
January New Home sales data comes on Wednesday, followed by the Consumer Price Index and Durable Goods on Thursday. The preliminary reading on 4th quarter GDP is out on Friday, along with the Chicago PMI, Consumer Sentiment, and Pending Home Sales.
Clearly, there is plenty of news and economic data for the stock market to digest this week.
What to Watch
The stock market grinded higher last week, and despite the series of new all
time highs in the S&P 500, the selling was well absorbed. In early Friday
trading, the S&P was down double digits before once again the bulls stepped
in to buy. The late afternoon news that the EU had reached an extension deal
with Greece pushed stocks sharply higher an hour before the close.
Another positive close sets the stage for a strong monthly close, even if we do see a pullback this week. The testimony of Janet Yellen or the GDP release on Friday might rekindle some bearish sentiment.
That would be a short-term plus for the market as last week's AAII survey reported a sharp increase in the bullish% to 47.02% from just 40% the previous week. The bearish percentage has been hit hard as it has dropped over 14% in the past two weeks and now stands at 17.88%.
Other sentiment measures like the put/call ratio are still in the buy mode, according to option expert Larry McMillan, who has some other concerns about the health of the market's rally. While the rally in the major averages has not shown any signs of upward acceleration, many stocks and sectors have done very well.
Last week I added two more healthcare stocks to the recommended list (Buy More Stocks in a Top Sector). The Sector Select Health Care (XLV) was up sharply on Friday and broke out of its recent trading range.
In the tech sector, one of my favorite industry groups is the semiconductors, as the Market Vectors Semiconductor (SMH) is up well over 9% from the February lows so our long positions are working out well.
The weekly technical studies remain positive but many have not yet confirmed
the price action. As long as they do not drop below the early February lows
they still point higher. There are no signs yet of a significant correction
from the A/D indicators and I shares some more signs to look out for in last
week's trading lesson More
Correction Warning Signs.
Click to Enlarge
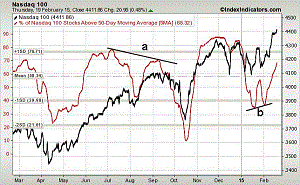
As I pointed out in last week's column (Will Stocks Melt Up), % of S&P 500 stocks above their 50-day MAs had clearly bottomed out. The chart of the number of Nasdaq 100 stocks above their 50-day MAs also looks quite strong as the % is rising sharply.
The 5-day MA last September formed lower highs, line a, prior to the sharp slide late in the month and in early October. As of Thursday, the 5-day MA was at 68%, well above the mean, but still well below the overbought levels above 80%.
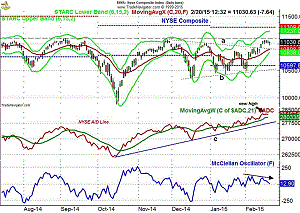
The daily chart of the NYSE Composite shows that after completing its short-term flag formation, lines a and b, it has continued higher but not accelerated to the upside. The target from the flag formation is in the 11,500 area. The NYSE and S&P needs to see a stronger rally like that of the Nasdaq 100 to turn them more bullish.
The daily starc+ band is now at 11,237, which is well above the 2014 highs
while the weekly starc+
band has risen to 11,366, which is just above the quarterly projected pivot
resistance.
Click to Enlarge
The daily NYSE Advance/Decline made another new high and has held well above its rising WMA. This suggests it would take some time before it could reverse course and warn of a correction.
The McClellan oscillator has been acting weaker than prices (see arrow) and while this is a short-term concern, it is not a strong warning sign in my opinion. As I have noted in the past, it does go through periods where it does not generate any signals. It does allow for it to drop quickly back to oversold levels with just a 1-2 day correction.
The 20-day EMA is at 10,903 with further support in the $10,750 area.
NEXT PAGE: Stocks
|pagebreak|S&P 500
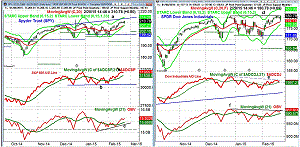
The daily chart of the Spyder Trust (SPY)
shows that it has continued to hold well above its rising 20-day EMA for the
past two weeks. The starc+ band and the trend line resistance, line a, are now
in the $213 to $214 area. The weekly starc+
band is at $216.60.
The daily S&P 500 A/D line finally made a marginal new high last week to
confirm the price action. Its WMA is clearly rising but does not yet look as
strong as it did last October (see rectangle) when it was in the acceleration
mode.
Click to Enlarge
The daily on-balance volume (OBV) is starting to look a bit stronger now, but it is still well below the December high. There is near-term support at the uptrend, line c, with further at the February lows. The weekly OBV (not shown) is back above its WMA but has also not made new highs. Stay with the previously recommended long positions and I may adjust the strategy this week via my Twitter feed.
Dow Industrials
The large cap SPDR Dow Industrials (DIA)
had been lagging as it got back to its all time highs, line d, but turned sharply
higher in late trading Friday and made new highs. The stocks in the index have
been more severely impacted by weak crude oil prices and the stronger dollar.
The daily starc+ band is at $183.88 with the weekly at $186.21.
DIA has short-term support now at $178.14 and the 20-day EMA is at $176.98 with the daily starc- band at $176.78.
The Dow Industrials A/D line has dropped down to test its WMA but it may break through its near-term downtrend, line e, with Friday's strong action.
The daily on-balance
volume (OBV) also turned up on Friday as it now challenging the resistance
at line f. It is very close to the all time highs. The weekly OBV (not shown)
is back above its WMA.
Nasdaq 100
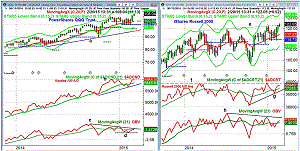
The PowerShares QQQ Trust (QQQ)
accelerated to the upside a week ago and continued higher last week. The daily
starc+ band is now at $109.42 with the upside target from the recent trading
range in the $109-$111 area. The weekly starc+ band could be hit this week at
$110.42. The quarterly projected pivot resistance is at $115.62 which is a reasonable
upside target.
The weekly Nasdaq 100 A/D line is now challenging its all time highs and once
the final data is in, new highs are likely.
Click to Enlarge
The weekly OBV is very close to breaking its downtrend, line c, which would be a good sign. A move above the late December high would lessen the impact of the weekly divergence that goes back to the middle of 2014. The key support is at line d.
There is initial support at $104.50-$105 as the QQQ
is now 3.2% above its 20-day EMA. It is a positive that the 20-week EMA is rising
consistent with a solid uptrend.
Russell 2000
The iShares Russell 2000 (IWM)
confirmed the breakout above December's all time highs as it is comfortably
above the resistance at line e. The daily starc+ band is now rising more sharply
and is at $124.82 with the weekly at $126.49. The quarterly projected pivot
resistance at $132.98.
The weekly Russell 2000 A/D line is above its WMA but is well below its all time high from December. It has not yet confirmed the new highs and needs to hold above support at line g, and the February low, to avoid a sell signal.
The weekly OBV is above its WMA but still below the long-term resistance at line h. The daily OBV (not shown) is now rising more sharply and is now acting much better.
There is now good support in the $119.50-$120 area with the rising 20-day EMA
now at $119.33. The daily starc- band is at $118.75 while the rising 20-week
EMA is $117.25. We are still long IWM
from our January
recommendation and will be adjusting the stops next week.
NEXT PAGE: Sector Focus, Commodities, and Tom's Outlook
|pagebreak|Sector Focus
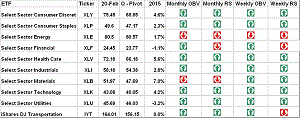
The iShares Dow Jones Transportation (IYT)
was higher for the week but is still barely lower for the year. The weekly OBV
is close to making a new high while the relative
performance does not suggest it has turned again into a market leader.
On February 12, I took a close look at IYT and the railroad stocks in Time to Ride the Rails and are still long IYT along with CSX. The daily studies have improved in the past week but a close above $166.50 would be bullish.
The leader so far in 2015 is still the Select Sector Materials (XLB) up 6.7% as XLB has rallied sharply after testing its quarterly pivot. The monthly OBV is still negative but the RS analysis is likely to turn positive by the end of the month.
The Select Sector Health Care (XLV)
broke out to the upside last week and is up 5.5% so far in 2015.
Click to Enlarge
In addition, the Select Sector Consumer Discretionary (XLP) and Sector Select Technology (XLK) also are doing well up 4.5% and 4.2% respectively. The weekly OBV on XLY turned positive last week.
The Select Sector Energy (XLE) gave up some of its gains last week, but as I discussed last week in Are Buffett and Barron's Too Bearish on Big Oil?, I think some of the high yielding oil stocks are getting closer to a bottom and would not bail out now.
Select Sector Utilities (XLU) did rebound last week and is now down just 3.3% for the year. My initial buy levels have been hit and XLU came very close to my second buy level.
The Select Sector Consumer Staples (XLP) is now up 2.2% for the year but the Sector Select SPDR Industrials (XLI) are now doing better as XLI is up 2.8%.
The Sector Select SPDR Financial (XLF)
was pretty much unchanged and I am still cautious on this sector.
Precious Metals
For the SPDR Gold Trust (GLD)
and Market Vectors Gold Miners (GDX),
both closed lower last week. In my review of these two ETFs, along with the
iShares Silver Trust (SLV),
I presented the technical evidence that the recent move higher was just a
bear market rally.
The Week Ahead
The action last week has clearly gotten more investor attention and does allow
for a melt-up
in stock prices this spring. As I noted in the What to Watch section there
are still some indicators that have not yet turned strongly bullish but they
continue to improve. We did not get the short-term pullback I was hoping for
but Friday's close suggests the market may move sharply higher first.
The majority of the January recommendations, based on the six point check list for 2015, are working out well and though we came close to being stopped out of our positions in the Spyder Trust (SPY) and iShares Russell 2000 (IWM) the longs now have nice profits.
Now is not the time to chase the market, and in this environment, one must consistently focus on the risk. There will be better risk entries to get in an index ETF or mutual fund for those who are not currently in the market.
There is a continuous sector rotation occurring, which will continue to provide
opportunities in individual stocks, but one needs to concentrate on market leaders
with positive volume.
Don't forget to read Tom's latest Trading Lesson, More Correction Warning Signs.
I will be on vacation next week and the next Week Ahead column will be published
on March 6th.
Some of Tom's Recent Most Popular Articles:
Abby's
Roundtable Picks for 2015
Are
These Tech Stocks Ready for Lift Off?
Do
Stocks Have Enough Juice to Breakout?


