
The key to making consistent profits in the markets is to enter trades where there is relatively low risk compared to much higher reward, thus MoneyShow’s Tom Aspray shows how you can spot good entry levels, set profit targets, and devise an exit strategy.
Picking tops or bottoms is generally quite difficult as one often does not have clear technical divergences that can give them enough conviction and discipline to take a position. Oftentimes traders will convince themselves that a market can’t go any higher or lower and keep fighting the trend as they are repeatedly stopped out.
Successful trading or investing is dependent on trying to put the odds in your favor and then having a clear exit strategy for when you are wrong. The S&P 500 had several wide swings in 2012, which made it a difficult year for many traders and investors. Buy and hold was only possible for those who were totally oblivious to current events.
Despite the powerful performance of the stock market in 2013 there were several classic corrections that allowed both traders and investors to buy. Clearly, 2014 has been even a more difficult year. To successfully trade retracements, you need to have patience and there are several technical tools that can help you identify in advance potential buying or selling zones.
Typically, when a retracement is ending, it will be a difficult time for the investor or trader as the market momentum and the sentiment is at a level that causes many to question their analysis making it more difficult to act.
I realized early in my career that most retracements take longer than one expects as one must consider how long the prior rally or decline has lasted. For example, if a rally last three or four months then a three-four week correction would not be surprising. On the other hand, if the breakout rally last just three weeks, a five- or six-day correction is often enough.
Click
to Enlarge
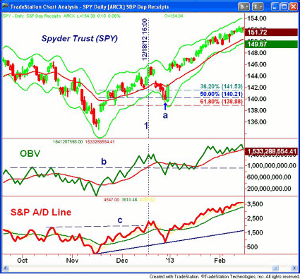
A good example of a retracement after a brief rally occurred in the Spyder Trust (SPY) towards the end of 2012. The SPY had reversed to the upside on November 16, which turned out to be a quite uncommon v-shaped bottom. Four days after the lows, the OBV and S&P 500 Advance/Decline line had both moved above their WMAs, which was a positive sign.
By December 12, the SPY had surpassed the early November highs and on December 18, (line 1) the OBV moved above the October highs, line b, as it was acting stronger than prices. The A/D line made a new all-time high as it overcame its high from both October (line c) and September.
The SPY was quite close to its daily starc+ band suggesting it was a high-risk area to buy. Three days later, SPY gapped lower as fears of the fiscal cliff hit the market. The Fibonacci retracement analysis revealed that the 38.2% level was at $141.53 with the 50% support at $140.21. The SPY closed on December 28 at $140.03 (point a).
At this point, SPY was close to the starc- band, which made the 61.8% Fibonacci support at $138.88 the key level to watch. It was also very close to the November 28 low of $139. The strong upside reversal the following day was quite a bullish sign even though the close at $142.41 was just 2.5% above the 61.8% support.
I have found that the first retracement from a bottom will often drop below the 50% support level while retracements that form have after more prolonged up or downtrend generally hold between the 38.2% and 50% retracement levels.
NEXT PAGE: Risk Management is Important
|pagebreak|Another reason I like retracement analysis is that you are able to develop several well-defined potential profit levels. Even if it turns out that a major trend change is occurring, you will often get a rally back towards the pre-retracement high. Of course, it is also possible to use Fibonacci analysis on the chart formation to determine other potential targets.
I have found the monthly and quarterly pivot analysis levels quite useful in determining where a retracement may end and also to signal when the major trend has resumed.
Click
to Enlarge
After looking at a large number of charts over the years, I can often spot those that appear to have a major trend that they are now retracing. If you spend the time, you should be able to also accomplish this. One of my favorite sites for this is www.finviz.com as it allows you to look ten charts per page that can be selected by sector or fundamental data.
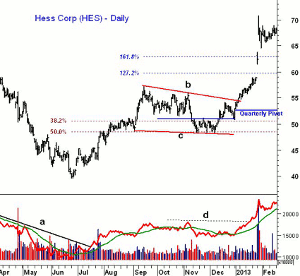
Let’s look first at Hess Corp. (HES). The first chart covers from April 2012 through February 2013. HES had peaked at $67.86 in February 2012 and by the end of June had dropped briefly below the $40 level.
To determine trend changes, one of my favorite tools is the multiple time frame analysis of the on balance volume that I discussed in a recent trading lesson. The daily OBV on HES had moved above its WMA at the end of June and then by the middle of July had broken its downtrend, line a. The weekly OBV (not shown) also formed a bullish divergence at the June lows.
In this article, I will concentrate on the more pronounced retracements, but one should note that after the initial upside spurt in HES, it dropped back to the minor 61.8% support. By August, the weekly OBV had turned positive as HES spiked to a high of $57.34 on September 14.
The steepness of the early September rally suggested a correction was likely and from the June lows, the 38.2% Fibonacci support was at $50.60 with the 50% retracement support at $48.60. As we started the fourth quarter, the pivot was at $51.08, which was also an important level to watch.
HES traded in a range for 31 days before dropping back to the 38.2% and quarterly pivot support. Those who were impatient and bought in the $52.50 area should have used a stop under the 61.8% support at $46.41. This would have been a risk of at least 11.6%. Taking this large a risk on any one position can eventually destroy your account.
After closing below the quarterly pivot, HES dropped to a low of $48.20 in the next five trading sessions. Since HES had rallied over 30%, I typically look to buy at the mid-point between the 38.2% and 50% Fibonacci support levels. In this case, that would have been at $49.60 with a stop at $46.18, which was 0.5% below the 61.8% support level.
Before any orders were placed, I always calculate the risk, which was 6.9% higher than I like. Moving the buy level to say $49.18 lowered the risk to 6.1% while buying HES at $48.60 would have meant a risk of 5%.
The initial upside target would be the old high at $57.34, so if you bought at $49.18, you were risking $3 for the potential to make just over $8. The November low of $48.20 was tested in December as HES dropped back down to $48.29. Those who were very patient had a chance to get an even better price since HES held the lower boundaries of the flag formation at line c.
NEXT PAGE: Calculating Retracements
|pagebreak|Using the November low, the 127.2% Fibonacci retracement target was at $59.90, which would have been the general level to part or half of the position. HES closed above the quarterly pivot on December 12, and then retested it at the end of the year. The flag formation was completed on January 4, and on January 25, HES opened at $63.15, which was above the 161.8% Fibonacci target at $62.88.
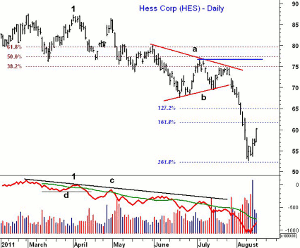
The same methods, of course, work in a down trending market. HES formed a top in the spring of 2011 as the OBV formed a negative divergence when HES was making its closing high (point 1). The divergence was confirmed when the OBV dropped below its support at line d. HES rebounded once more toward its highs before the selling picked up in early May.
Click
to Enlarge
On June 20, HES had a low of $67.65, which was over 22% below the high at $87.40. These two points could be used to calculate the Fibonacci retracement levels. The 38.2% retracement resistance was at $75.17 with the 50% level at $77.54. Therefore, the mid-point was $76.35.
On July 5, HES hit $77.12 and just barely exceeded the quarterly pivot at $76.69. For those considering a short position and sold at $76.35, the 61.8% retracement resistance was at $79.90. Therefore, a stop at $80.30 (0.5% above $79.90) would have been appropriate. This would have been a risk of 5.2%.
As it turned out, HES eventually formed a flag formation but the OBV started to break down before it was completed, which supported the negative technical outlook. The 127.2% Fibonacci retracement target at $64.93 and the 161.8% target were hit on two consecutive days in early August. HES finally hit a low of $52.63 before it rebounded.
Click
to Enlarge
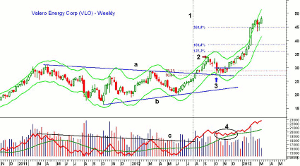
Another oil company that is still part of the Charts in Play portfolio is Valero Energy Corp. (VLO) and this time we will look at the weekly chart. VLO formed a broad trading range between May 2011 and July 2012. VLO started turning higher in the summer of 2012 as the weekly OBV moved above its WMA at the end of June.
The OBV broke through its downtrend, line c, at the end of July (line 1). Two weeks later, the price resistance, line a, was also overcome. On September 14, VLO reached its weekly starc+ band (point 2). The next week, VLO closed lower indicating that a retracement might be underway.
The quarterly pivot was at $29.98 while the 38.2% Fibonacci support, calculated from the June low to the September high, was at $28.86. The 50% retracement support level was at $27.18. The mid-point was therefore $28.02 and the risk to 0.5% below the 61.8% support at $25.50 was 9.6%.
This was clearly too high but between October 12 and early November, VLO tested the 38.2% level several times and then closed back above its 20-day EMA on November 6 on good volume. On November 7, I recommended buying at $29.68 and $29.14, which was below the prior day’s close at $30.06. I used a stop at 27.68, which was below the multiple lows in the $27.89 area.
As it turned out, over the next week, VLO tested the $28.60 level twice and just before Thanksgiving completed its daily flag formation. It was a positive sign that throughout the correction from the September highs, the weekly OBV held above its WMA (circle 4).
NEXT PAGE: Don't Buy Too Early
|pagebreak|The 127.2% Fibonacci retracement target was at $35.97 and on January 15, the 50% sell level at $35.98 was hit. Soon after, the 161.8% target was reached, and by early February, the 261.8% Fibonacci target at $44.64 was also exceeded. VLO consolidated at the weekly starc+ bands for several weeks in the latter part of February where some additional profits were taken. Another meaningful correction is likely sometime this year.
Click
to Enlarge
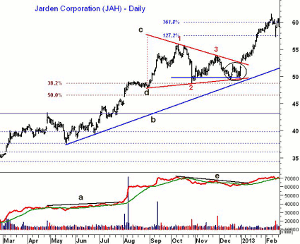
Jarden Corporation (JAH) is a $4.6 billion dollar provider of housewares and accessories, which after a 38.2% correction into the May 2012 low of $37.39 began a new uptrend. The OBV surged through resistance, line a, in August, which was a bullish sign. When JAH peaked on October 17 at $55.77 (point 1), the OBV formed a slight negative divergence (line e).
The first wave of selling was quite heavy as JAH dropped below the quarterly pivot at $49.80 and reached the 38.2% support at $48.72 (point 2). This took JAH back to the support from August and early September, which may have encouraged some to buy.
This is generally not a good idea, but in this case, it could have worked. Those who bought the first pullback (point 2) were likely tempted to raise their stop once JAH rebounded back to $53.95 (point 3). That stop would probably have been hit on the following decline.
This is where patience is so important as after a rally that lasted from the middle of May to the middle of October, a more lengthy correction would be expected. More often, the next part of the correction phase will take the stock below the initial low by enough to stop one out before the retracement is over.
By December 14, JAH traded down to $49.40 and tested the lower boundary of the flag formation, line d. It dropped below the quarterly pivot that day but closed back above it. A nice bottom formation formed over the next two weeks (see circle) before JAH gapped through resistance at line c, to start off the New Year.
By January 22, the 127.2% Fibonacci target at $57.74 had been hit and two weeks later the 161.8% target at $60.20 was exceeded. As I have discussed in past articles, I also use traditional chart methods to obtain price targets. In this instance, the height of the flag (dashed red line) was $9.81, which when added to the breakout level at $52.59 gives you an upside target at $62.40. JAH spiked to a high of $64.87 on February 27.
If you are looking for stocks to buy, the tools that I have discussed here can be found online or created using a spreadsheet. I would suggest you start by scanning charts and looking for those who have had significant rallies and are now correcting from those highs. Try to come up with at least ten candidates.
Once you have your list , first look at the long-term charts to be sure that the rally was not just a rebound in a longer term downtrend. Then do your calculations of the retracement levels, quarterly and monthly pivots, as well as your chart analysis. Do a risk calculation based on buying the midpoint between the 38.2% and 50% Fibonacci support levels with a stop under the 61.8% support.
If the risk is too high on a stock, don’t give up on it but set up some price alerts at the 38.25 and 50% support levels, as well as the quarterly pivot. Sometimes, as was the case with Valero Energy (VLO) and Jarden Corporation (JAH) you will get a period of price consolidation during the retracement that will allow an entry where a lower risk stop can be used.
Related Reading:
Profiting From Fibonacci Entries and Exits
Predicting Price Targets with Fibonacci
No Need to Pick Bottoms or Tops


