The buy-to-open put/call ratio volume on major exchange-traded funds (ETFs) indicates that Hedge Funds may be getting long the market reports Todd Salamone.
Bulls were treated to another round of buying last week, as Fed Chairman Jerome Powell and other Fed governors reiterated that they can be patient evaluating data and raising rates. The fact that the S&P 500 Index (SPX) took out its 2018 lows gives more credence to a V-rally.
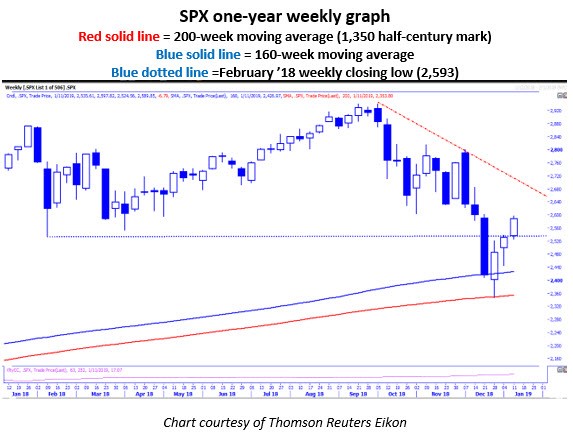
That said, after moving above the February 2018 daily closing low of 2,581 on Wednesday, the SPX didn't make much headway. Profit-taking may have slowed the momentum, as the SPX climbed to the 2,586 area, 10% above the Christmas Eve closing low of 2,351. The good news for bulls is that the SPX has now closed five consecutive days above its closes on Dec. 18-19, when the Federal Open Market Committee raised rates. Typically, if a pullback occurs immediately after a rate increase, such Fed-day closing levels will act as short-term resistance. Therefore, the area between 2,506-2,546 remains a first line of defense for bulls in the short term.
The rally has continued following an important weekly close for longer-term investors above the SPX's 160-week moving average in late December, after a beginning-of-the-week break of this trendline on Christmas Eve. The low on Christmas Eve occurred at the SPX's 200-week moving average, which is another trendline we'll focus on if the lows are retested in the coming weeks or months. We noticed that this trendline marked the exact lows in 1987, February 2016, and December 2018, making it worthwhile to have on your radar, particularly during periods of market distress like December. Just as the 160-week moving average is approximately a three-year moving average that we have focused on for weekly closes, the 200-week moving average is a round-number moving average that approximates a four-year moving average.
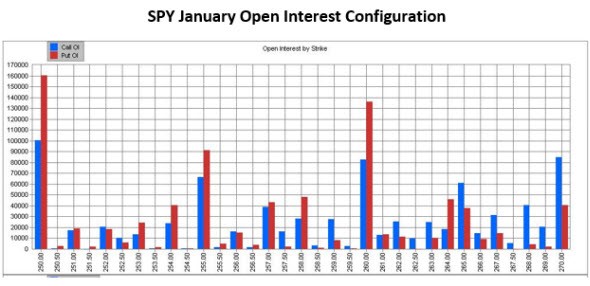
SPX resistance at 2,600 could take on more importance this week, with standard January options due to expire. Because of this, we turn to the SPDR S&P 500 ETF Trust (SPY) January open interest configuration, where there is a huge amount open interest at the 260 strike, which is equivalent to SPX 2,600. Buying and selling related to this open interest could create a speed bump through Friday's expiration, much like the week-long speed bump that occurred around the 250 strike from the end of December into the first week of January.
A delta-hedge sell-off, like we saw in December, is unlikely given how far out-of-the-money the major put open interest is coming into expiration week.
If we look beyond January expiration, there are multiple resistance levels overhead with which the SPX must overcome if it continues to make its way higher. A major area to watch is between 2,650 and 2,690 (through this Friday), which represents potential trendline resistance when connecting the Oct. 3 peak with the Dec. 3 peak (you can see this trendline on the SPX chart above). Levels connected with this trendline move lower as time passes, which is why I gave a wide range to monitor beginning with this week into early February.
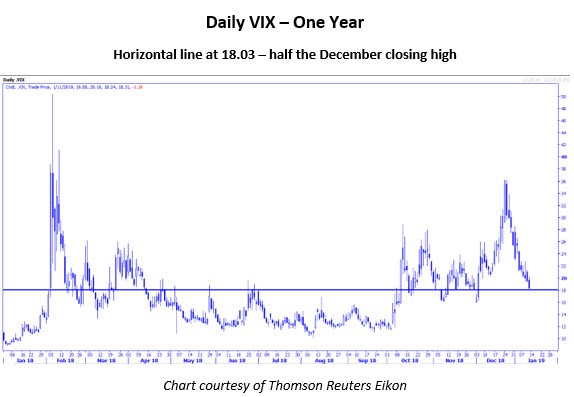
The Cboe Volatility Index (VIX) action could give us a clue as to whether the next move will be a retest of the low or a continuation rally from the December bottom. The VIX comes into the week situated between half its December closing high at 18.03, but below half its 2018 closing high at 18.66 and double its 2018 closing low at 18.44. In other words, this area between 18.03 and 18.66 is significant relative to important closing highs and lows since January 2018. A daily close below 18.03 could indicate lower volatility ahead, combined with further strength in equities.
Unfortunately, with the government shutdown, the net positions of VIX futures large speculators has not been reported by the Commodity Futures Trading Commission (CTFC). As of the last report date, Dec. 18, this group, which is usually wrong at major turning points in volatility, was in a rare net long position. This favors the bulls, especially after the SPX's bounce from long-term moving average support around the time of the position update.
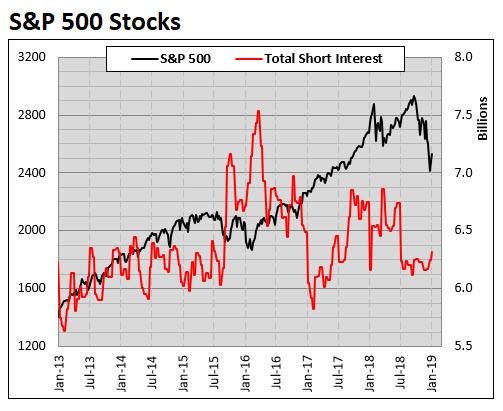
Finally, I’ll leave you with what appears to be potentially good news for bulls. As the market rallied from the Christmas Eve closing low, it looks like shorts indeed built up positions, but it was not a very big buildup, according to short interest data as of Jan. 1, 2019, that we compiled on SPX components. The fact the SPX rallied during this build is also encouraging, as it is indicative of money coming off the sidelines that was able to overcome the shorting activity, and many of the freshly added shorts are now in a losing position, which might generate covering.
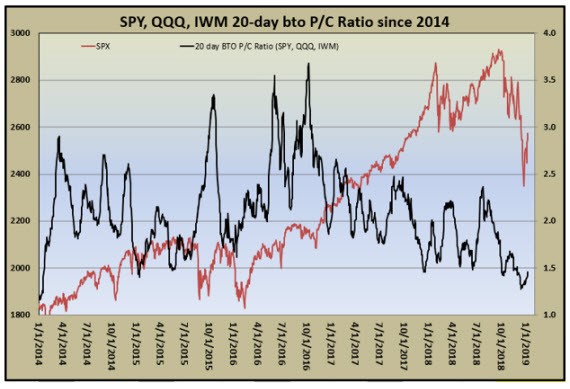
There is still a risk to bulls that the shorts are looking for higher levels to unleash their fury. But it appears that the group that might be most prone to building a short position, hedge funds, may be looking to build long positions instead. For example, look at the chart below that quantifies buy-to-open put and call volume on major exchange-traded funds (ETFs), such as the SPY, iShares Russell 2000 ETF (IWM), and tech-laden Invesco QQQ Trust Series (QQQ).
Since some hedge funds use these ETFs as hedging vehicles, the buy-to-open put/call volume ratio tends to decline because they are either liquidating long positions (buying fewer puts as a hedge) or buying more calls relative to puts as they build short positions. The ratio rolled over prior to the most recent setback, as put buying plunged (indicative of hedge funds liquidating long positions).
The ratio recently bottomed at a multi-year low and is now ticking higher, due to put demand growing again. When the buy-to-open put/call volume ratio was this low in early 2014 and began moving higher, it was a major buying opportunity, as the hedge funds were likely in accumulation mode, building long positions from a historically low exposure level. All indications are these funds have very low stock exposure, and continued accumulation from this crowd could drive the SPX through resistance.