
John Rawlins takes a long-term look at Boeing, Cisco and the EUR/GBP.
We have provided numerous short-term trading signals based on the QuantCycles Oscillator cyclical analysis over recent weeks. This week we will take a step back and show some longer term plays. Yesterday we touched on the commodity sector, here we provide some interesting longer-term charts in stocks and forex.
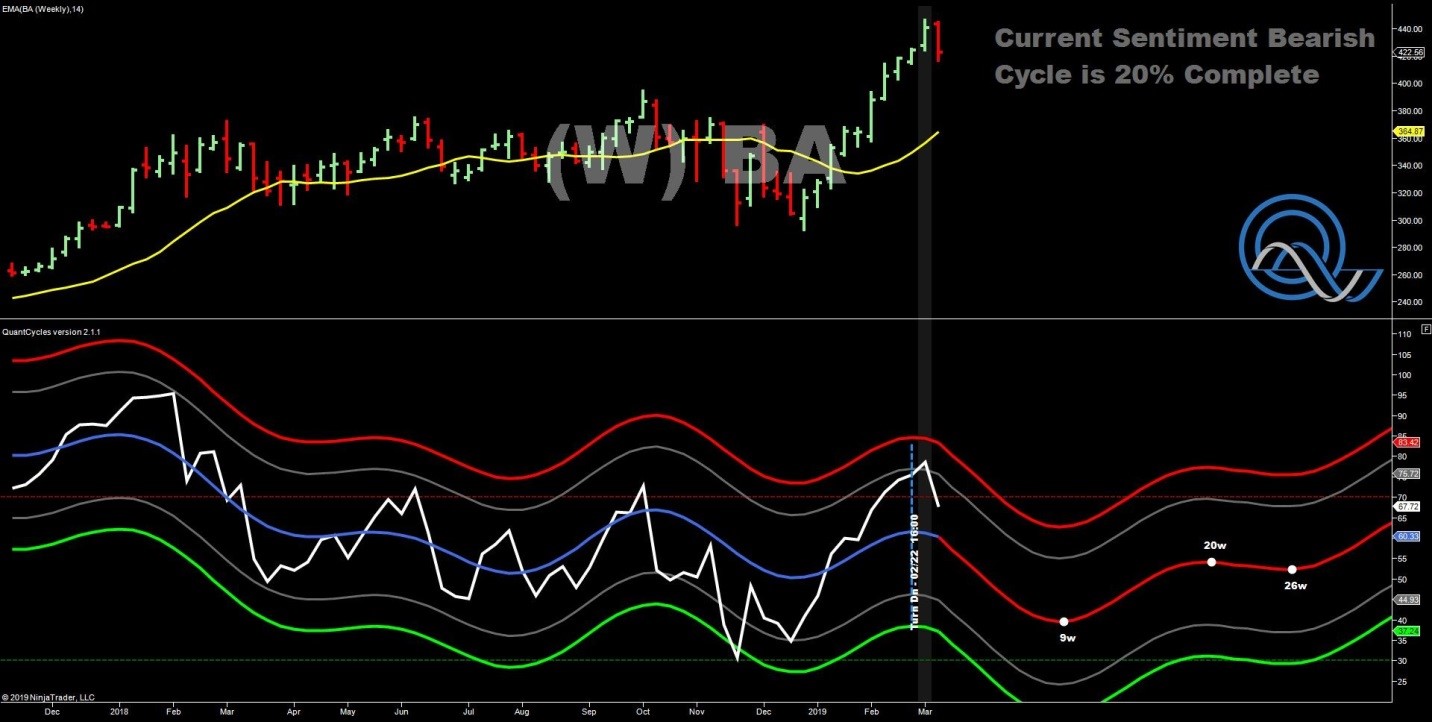
Boeing
Boeing (BA), has soared during the equity market rebound from the Q4 sell-off. It has outperformed the broad equity market, rising well above its previous all-time highs.
Last week it appeared to turn after the QuantCycle had Boeing turning lower a couple of weeks prior. BA was close to extreme overbought territory and the QuantCycle suggests BA will continue to drop over the next nine weeks.
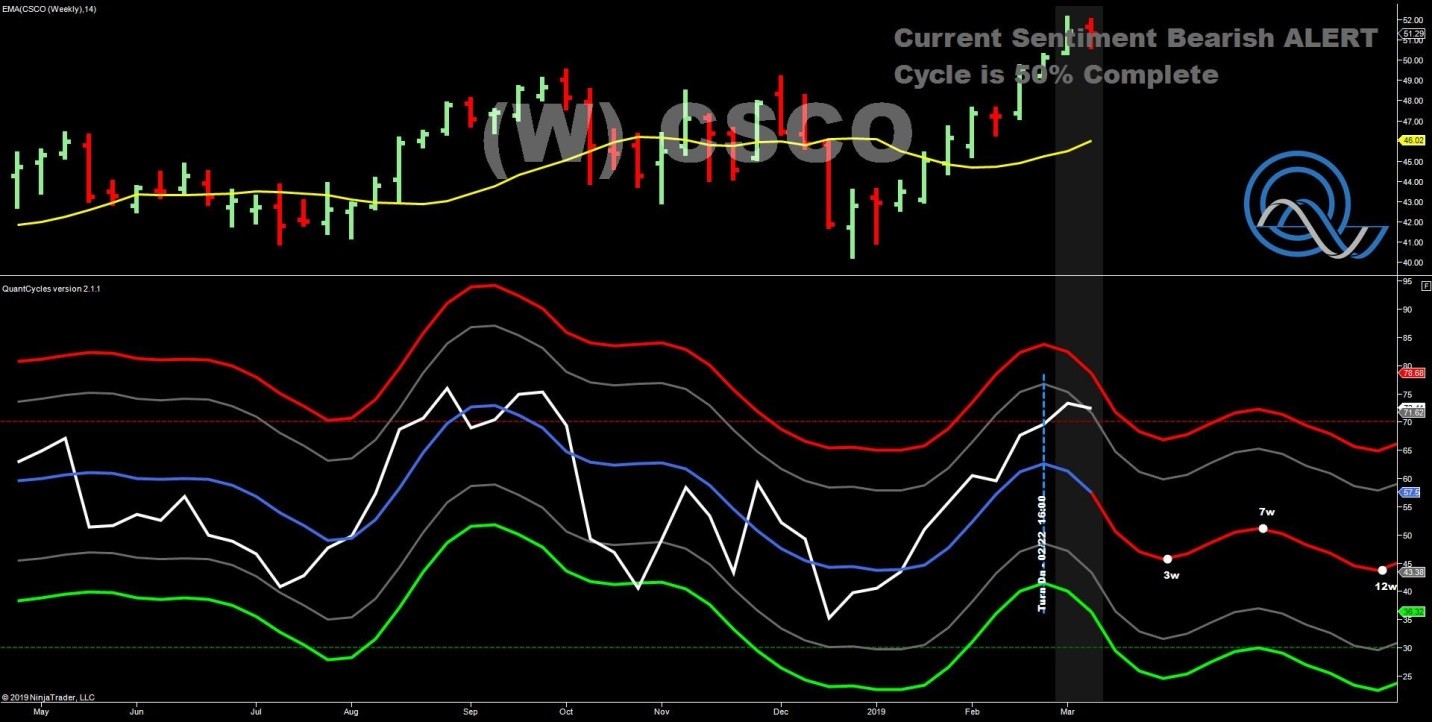
Cisco Systems
The tech sector has been on a roll, and like BA, Cisco Systems (CSCO) has risen to new highs, but faltered last week. The QuantCycle has CSCO near extreme overbought conditions and expects it to drop significantly over the next several weeks.
iShares MSCI Hong Kong ETF
No factor has weighed on the broad market over recent months as much as U.S.-China trade negotiations. The iShares MSCI Hong Kong ETF provides exposure to equity markets in Hong Kong. The ETF has rallied sharply in 2019 after declining most of 2018. The rally has put it in overbought territory just as the weekly y QuantCycle has it turning sharply lower (see chart).

This is a strong sell signal that could last over the next three months.
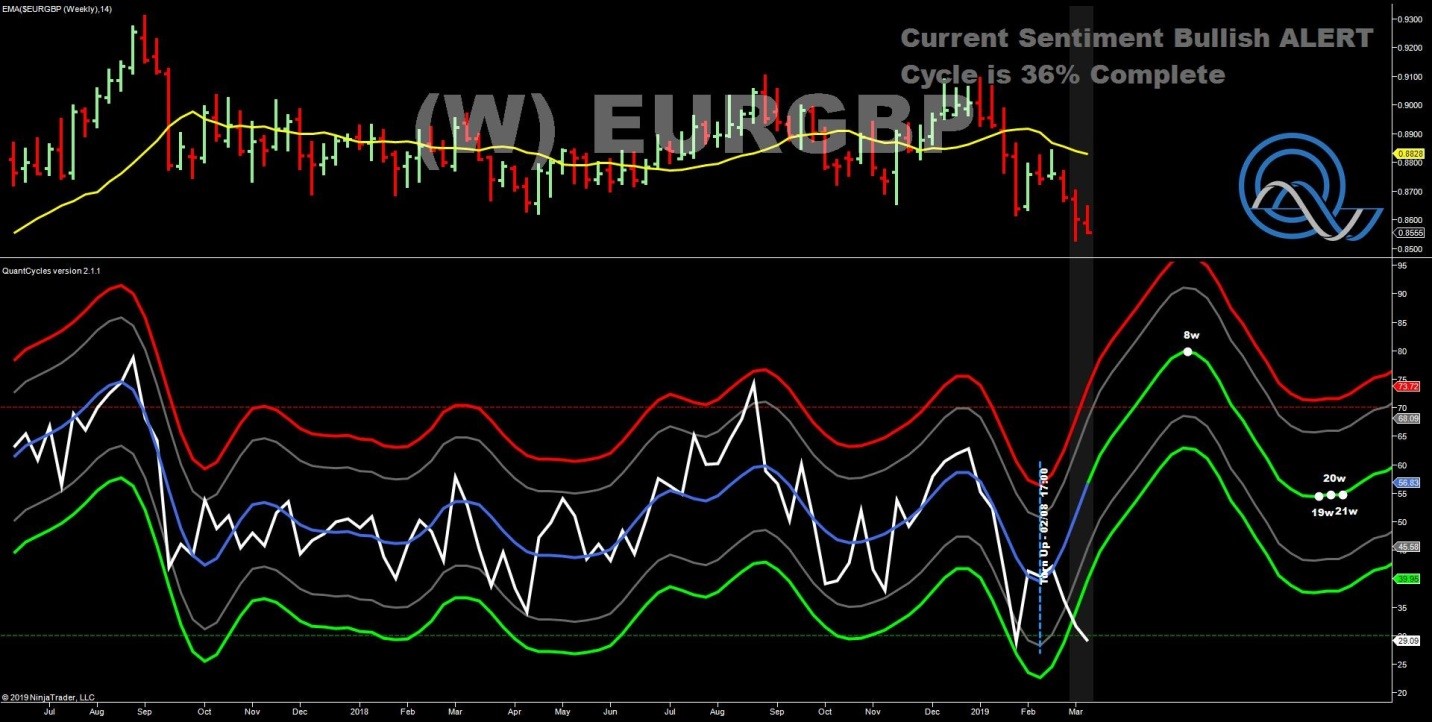
EURGBP
The other major geopolitical factor driving markets is ongoing negotiations over Brexit.
Failure to secure a Brexit plan has driven the EUR/GBP currency pair sharply lower. It now stands in extremely oversold territory, just as the QuantCycle has it turning sharply higher over the next eight weeks. This is as strong of a bullish indicator as we have seen recently.
John Rawlins described the value of the QuantCycle Oscillator recently at the Orlando MoneyShow.
The QuantCycle indicator is a technical tool that employs proprietary statistical techniques and complex algorithms to filter multiple cycles from historical data, combines them to obtain cyclical information from price data and then gives a graphical representation of their predictive behavior (center line forecast). Other proprietary frequency techniques are then employed to obtain the cycles embedded in the prices. The upper and lower bands of the oscillator represent a two-standard deviation move from the predictive price band and are indicative of extreme overbought/oversold conditions.


