
The QuantCycles Oscillator shows bullish set-ups in gold and cotton this week.
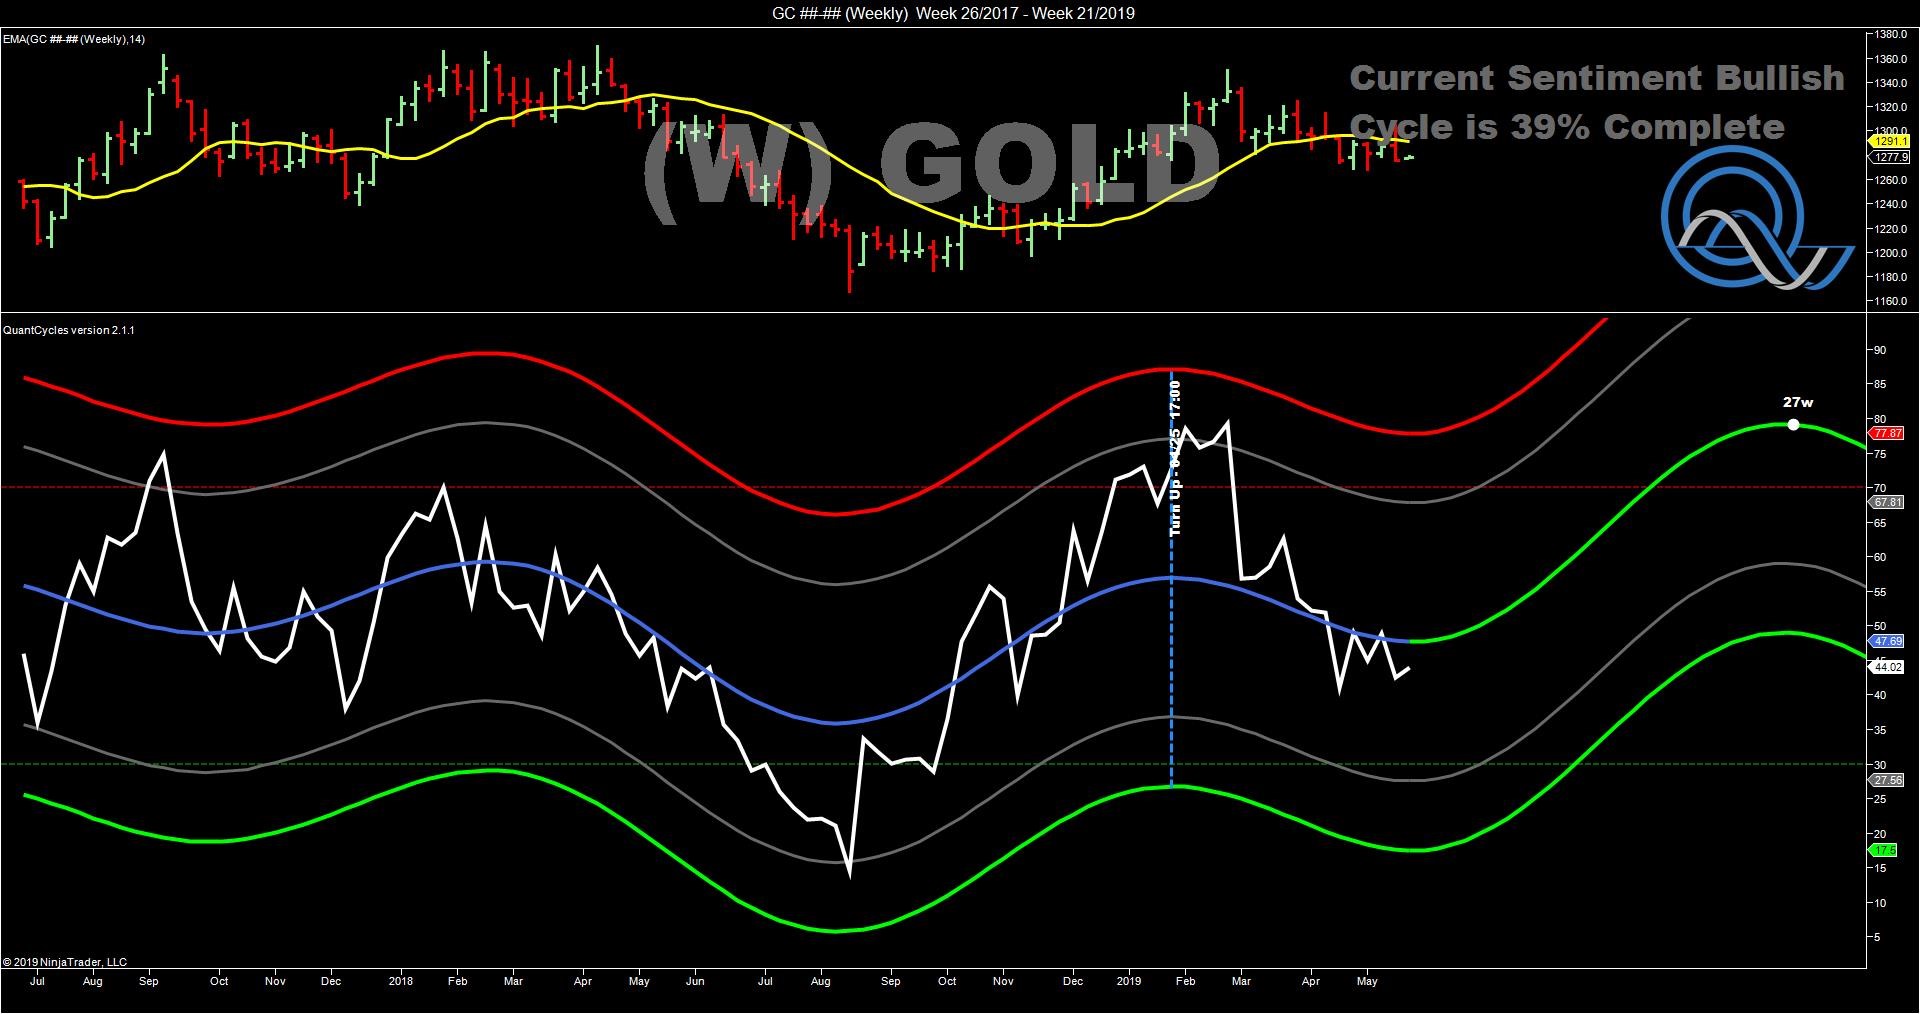
The long-term (weekly) outlook for gold is turning positive on the QuantCycles Oscillator (see chart).
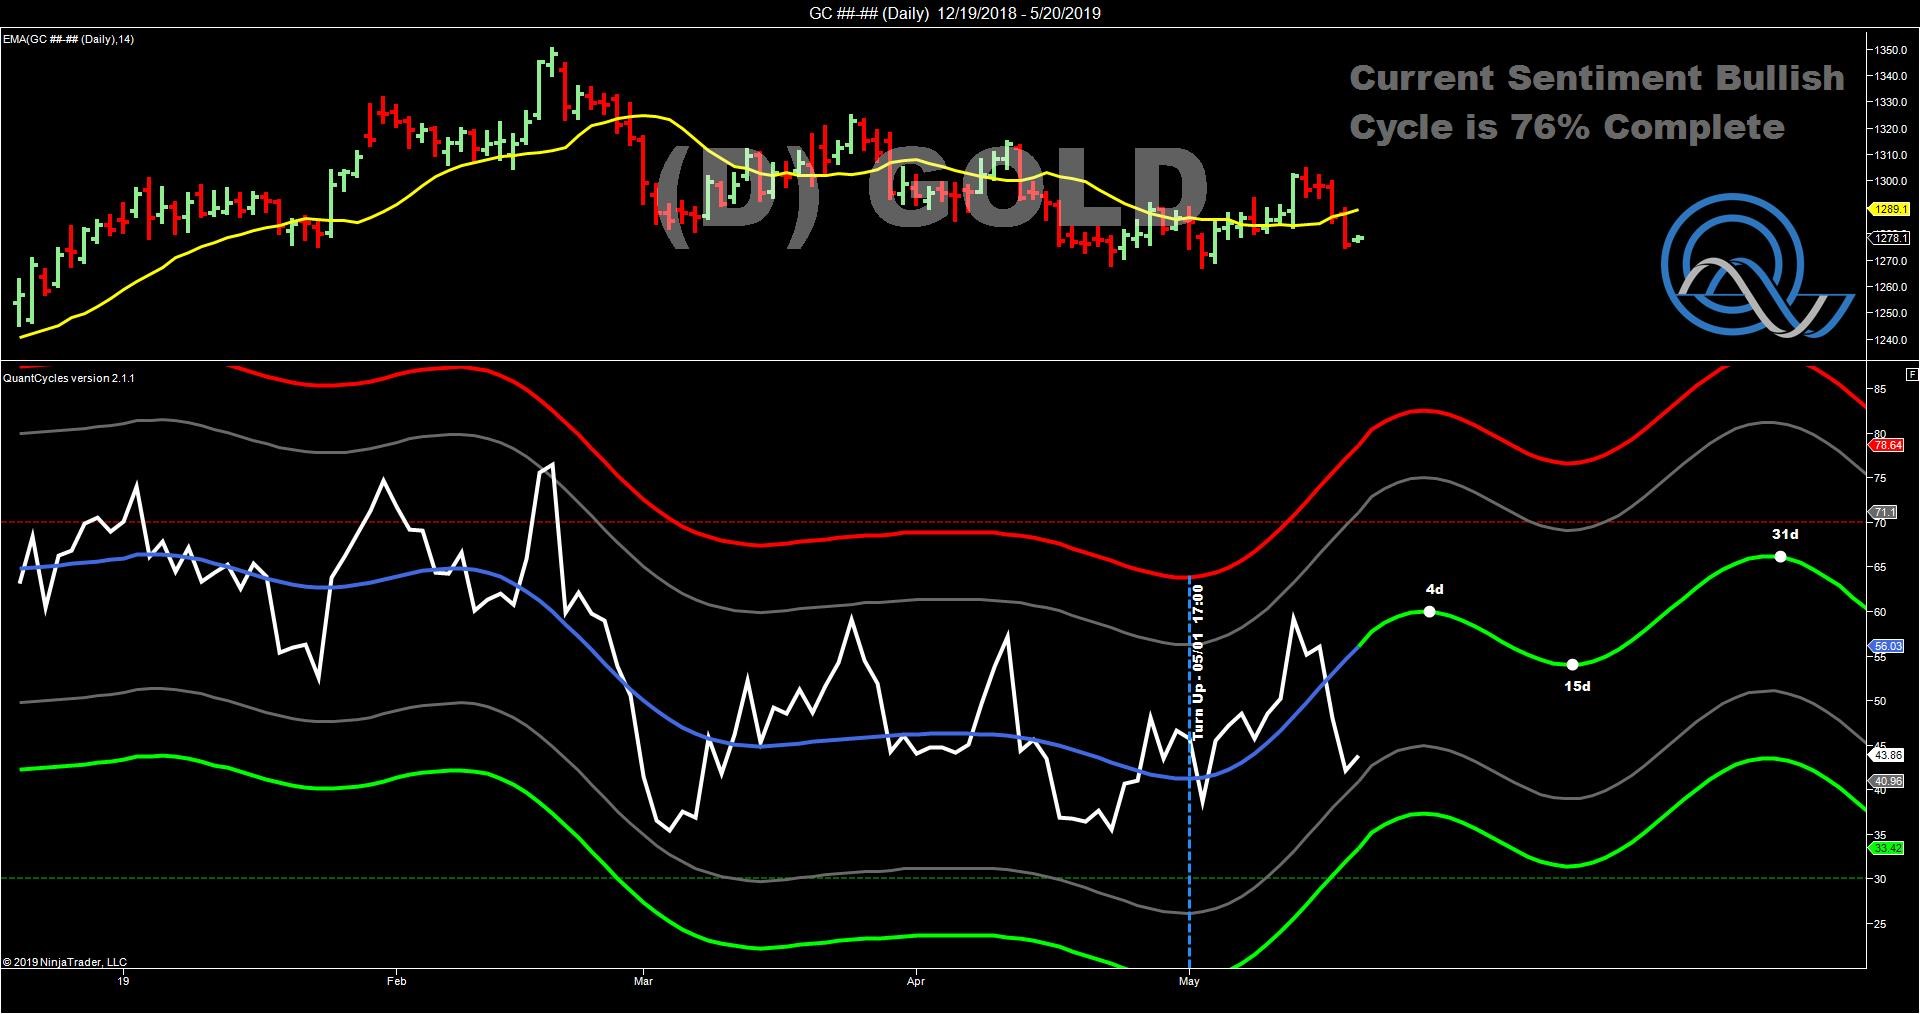
The daily QuantCycle still appears to have more upside despite last week’s weakness, which pushed it near oversold territory.
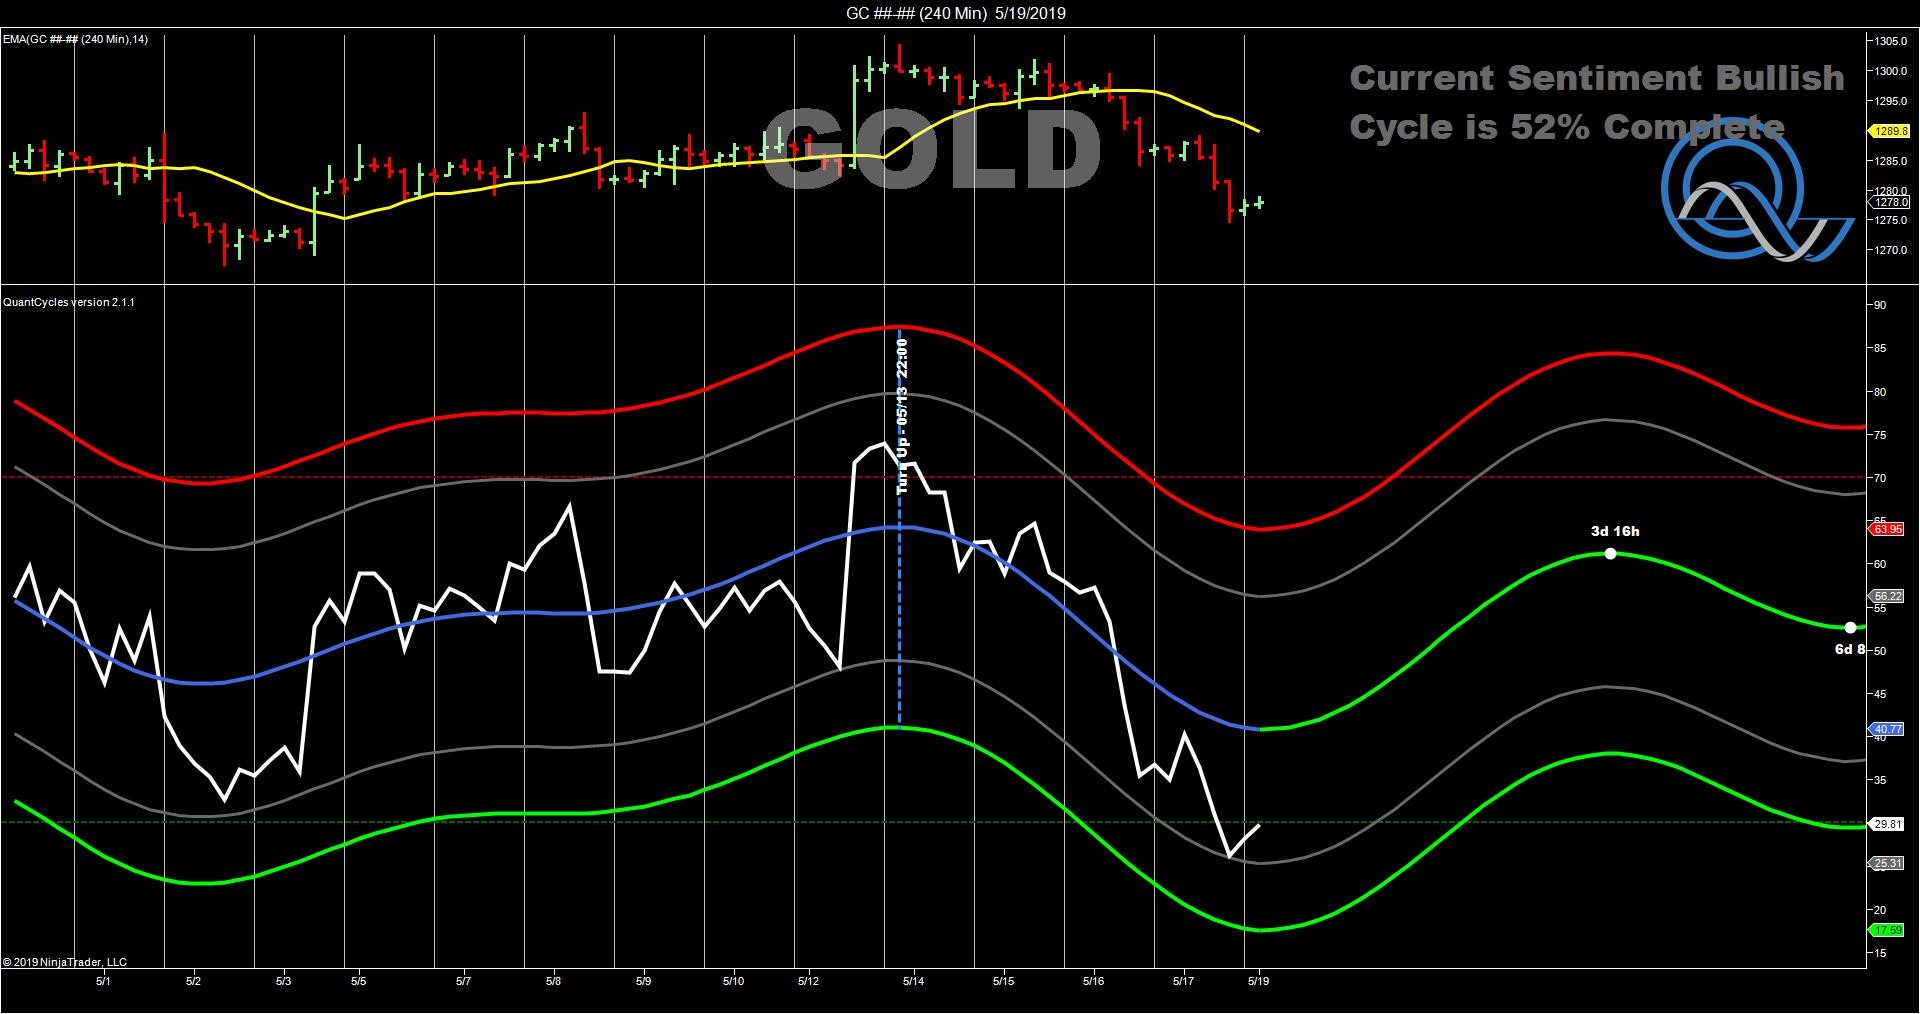
The four-hour chart matches up with the longer-term chart. It turned higher just as gold rebounded at the end of last week (see chart). This is presenting a solid buy signal for the week ahead.
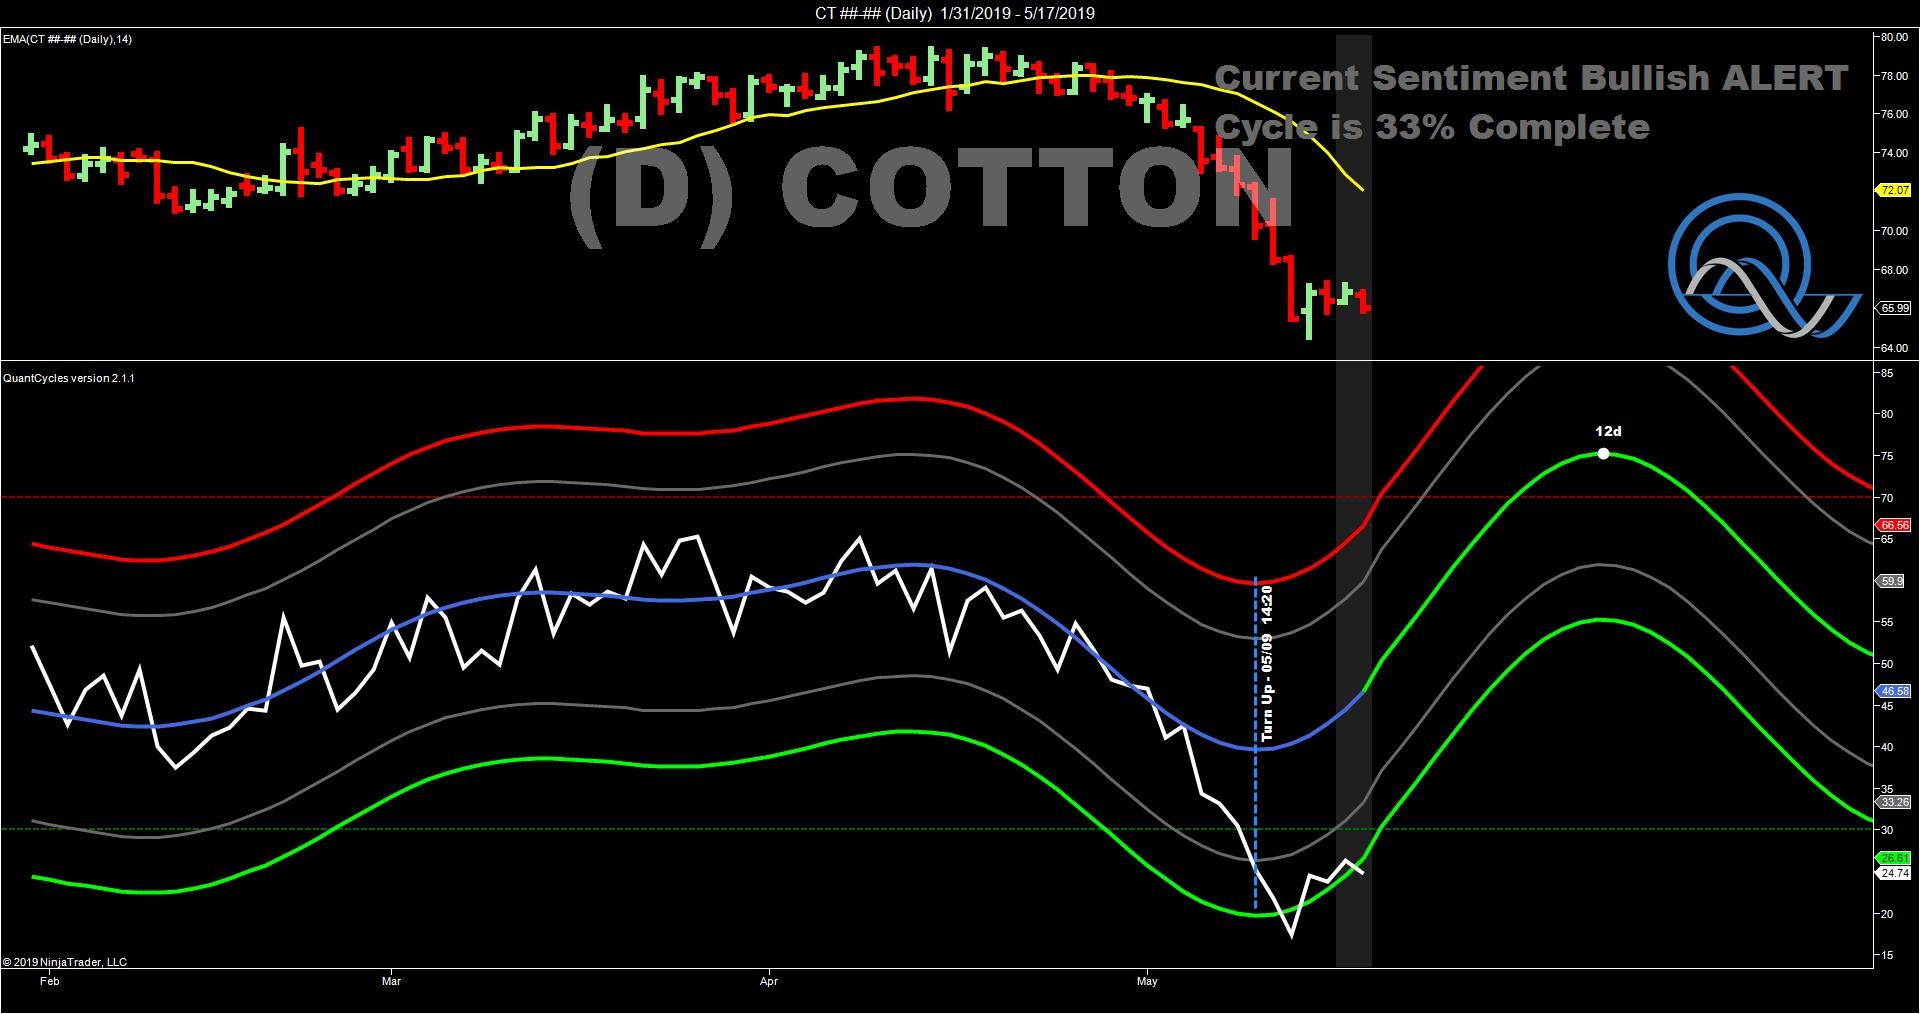
Cotton
The sharp sell-off in cotton over the last two weeks has put it in extreme oversold territory.
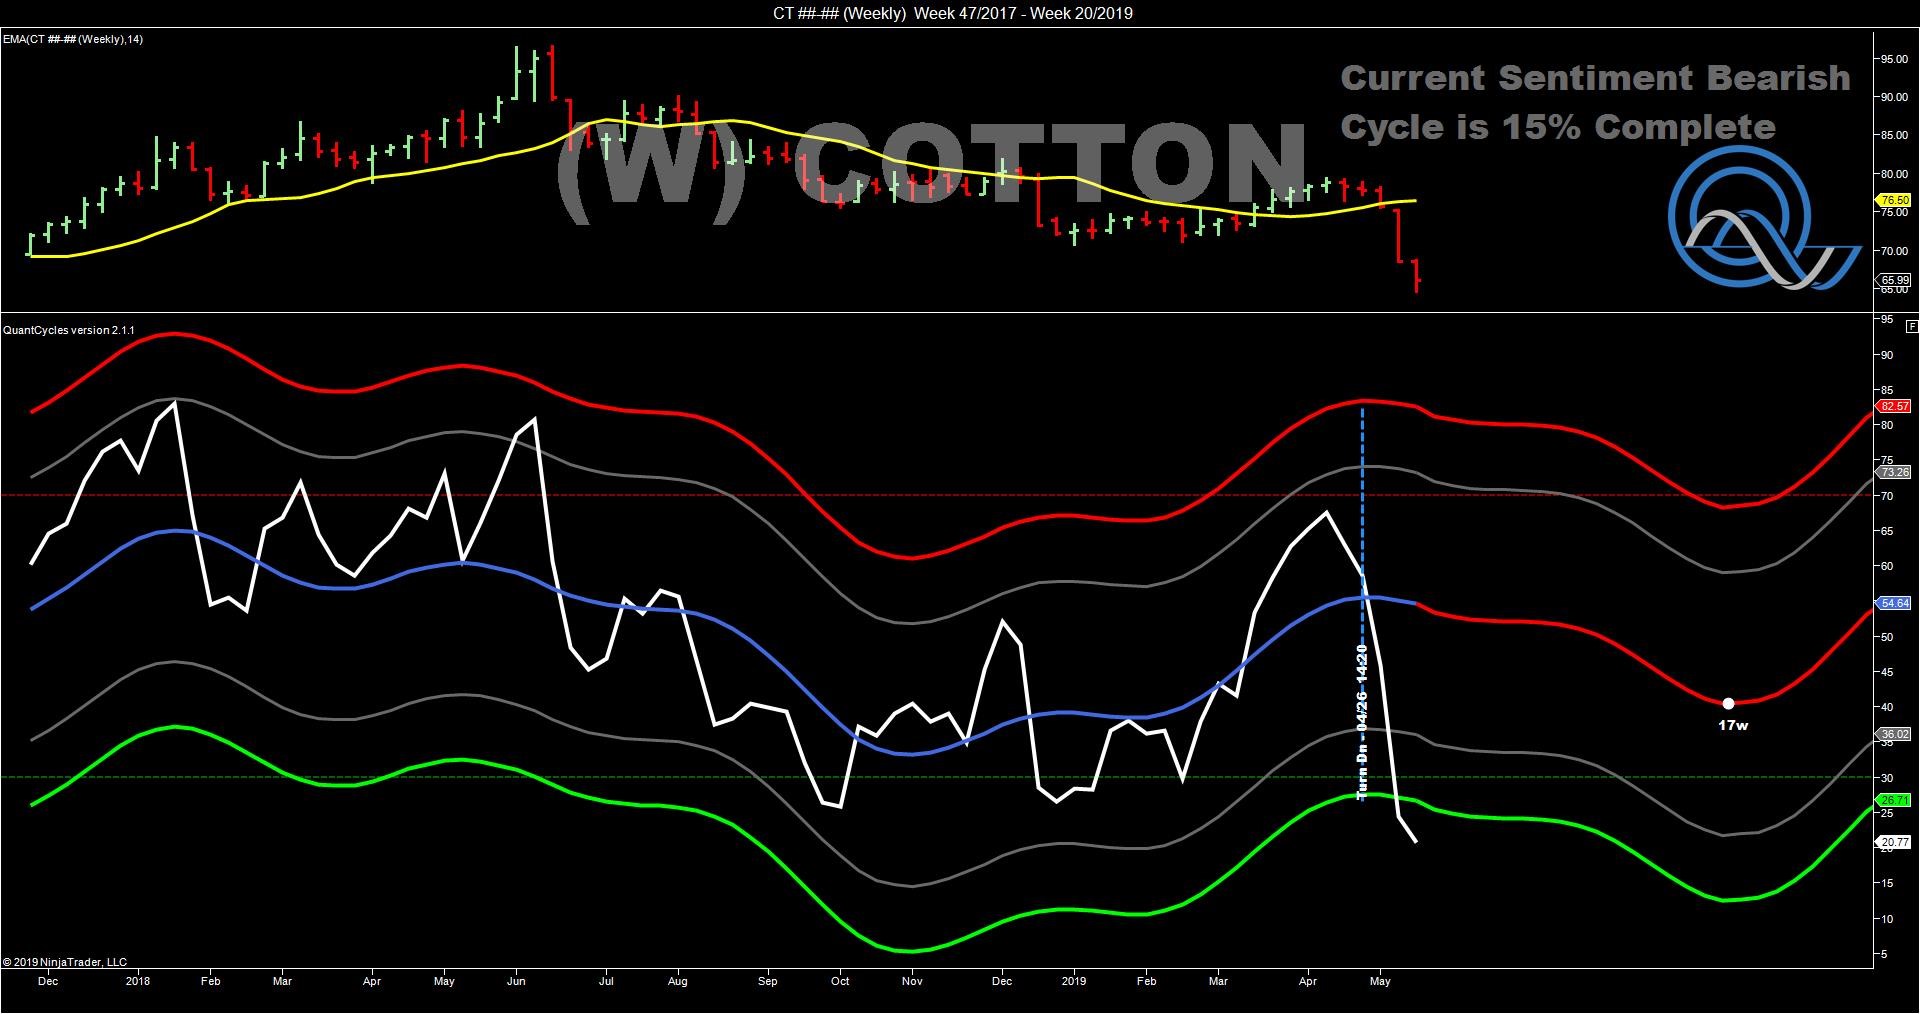
Despite the fact that the weekly oscillator is still indicating that cotton is in a downtrend, there is a chance for a significant correction given its oversold outlook.
This is confirmed in the daily oscillator, which turned higher last week, and is also in extreme oversold territory. Cotton appears ready for a healthy two-week rally from current levels.
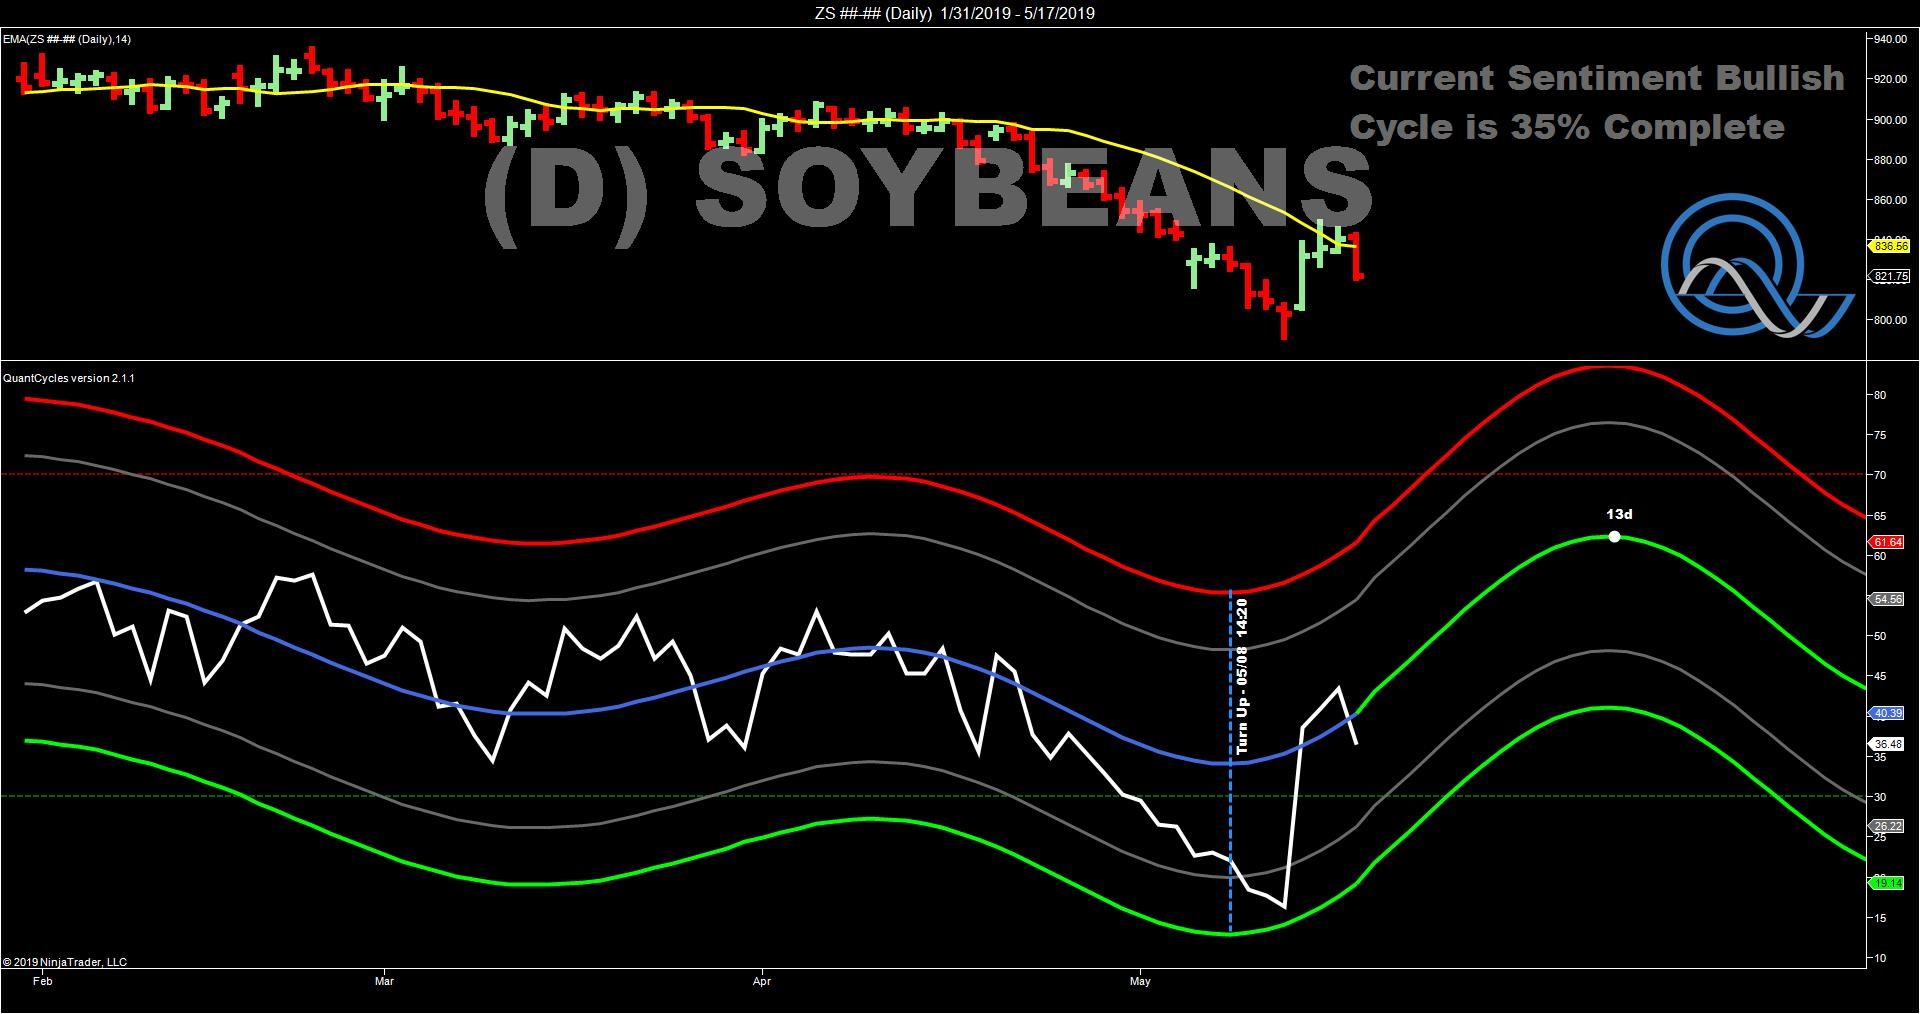
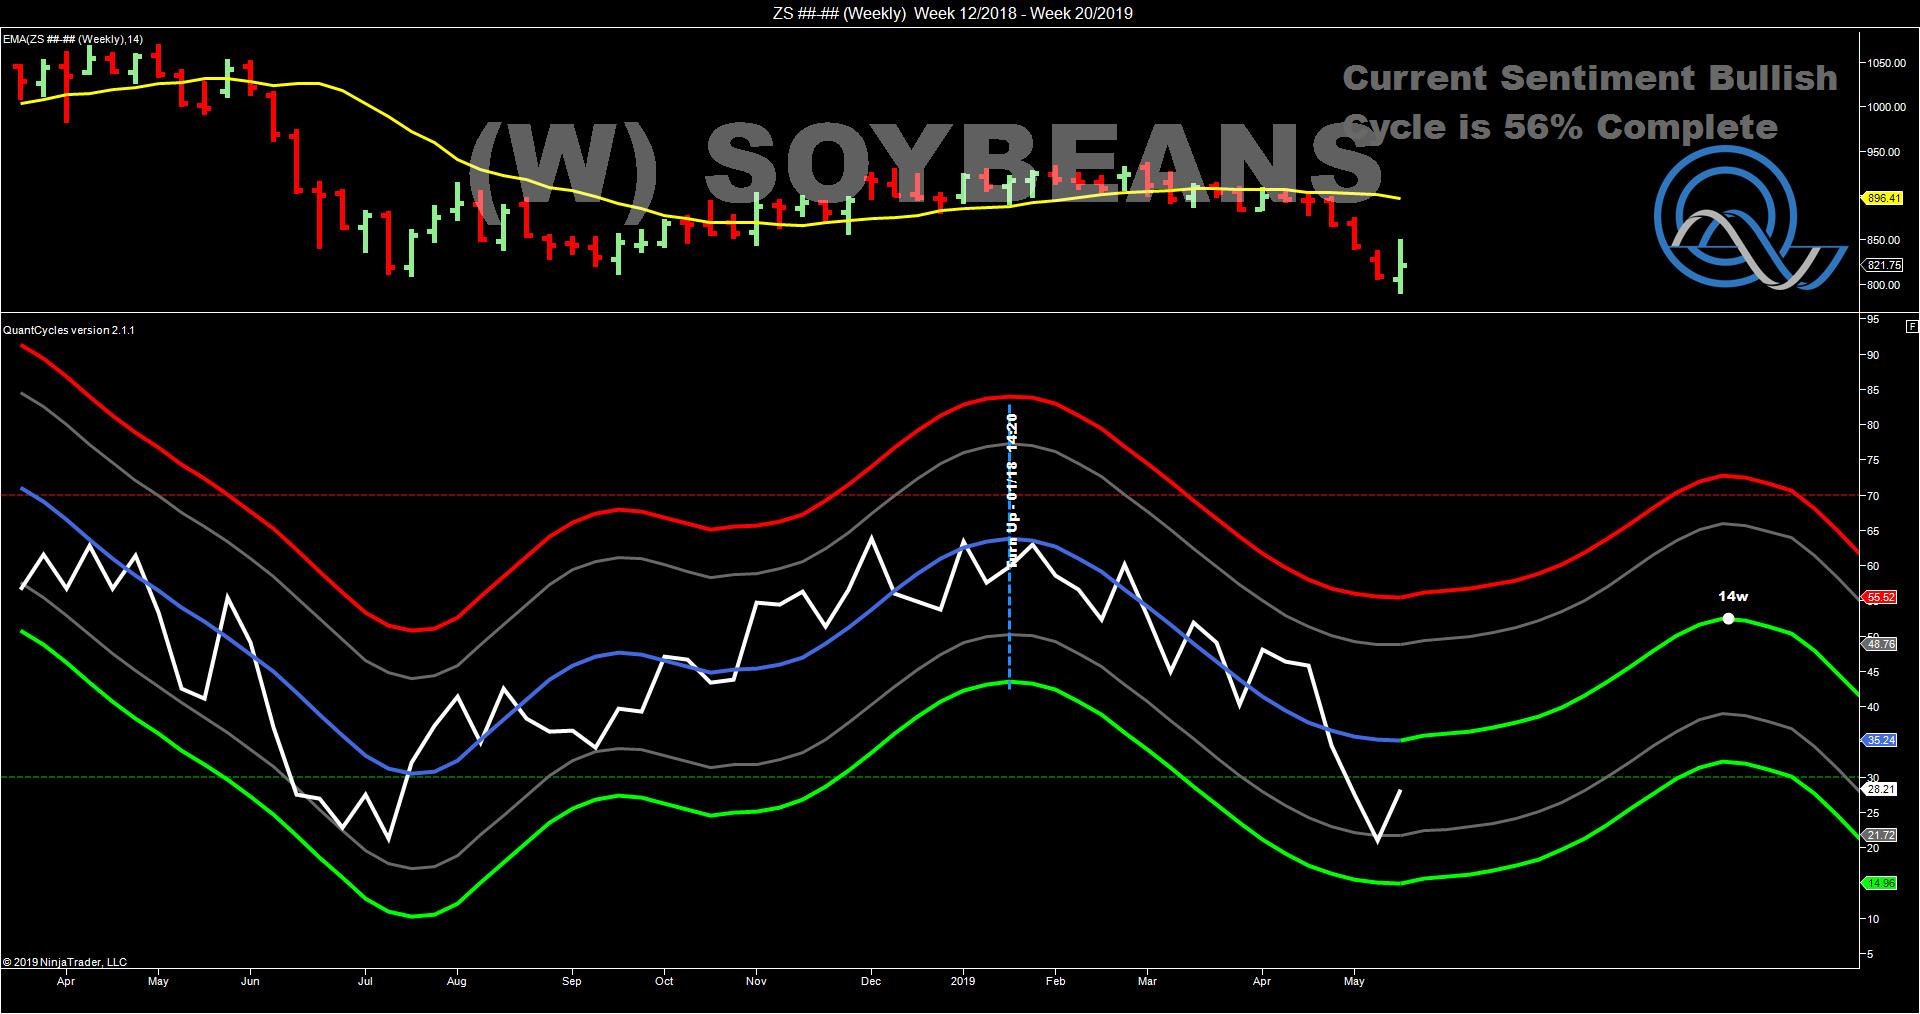
Good Call!
On May 10 the QuantCycles Oscillator sent of a strong bull signal in soybeans. The following day it bottomed out and beans have rallied since.
Long gave back some profits on Friday, but the daily and weekly QuantCycles Oscillator shows that there is still more room on the upside (see charts).
John Rawlins described the value of the QuantCycles Oscillator recently at The Orlando MoneyShow.
The QuantCycles indicator is a technical tool that employs proprietary statistical techniques and complex algorithms to filter multiple cycles from historical data, combines them to obtain cyclical information from price data and then gives a graphical representation of their predictive behavior (center line forecast). Other proprietary frequency techniques are then employed to obtain the cycles embedded in the prices. The upper and lower bands of the oscillator represent a two-standard deviation move from the predictive price band and are indicative of extreme overbought/oversold conditions.


