The hot start to 2019 could mean more upside for stocks based on historical precedent, reports Rocky White.
In case you haven’t heard, the S&P 500 Index (SPX) gained just over 17% in the first half of 2019. That’s the strongest first half of a year since 1997. The question now is whether a six-month rally like this can continue for the rest of the year.
Let’s look at prior years with similar set-ups and see how the rest of the year fared. I’ll show a few different stats to best suit the current environment. Hopefully, it gives us some insight for what to expect for the rest of 2019.
Big First Halves for Stocks
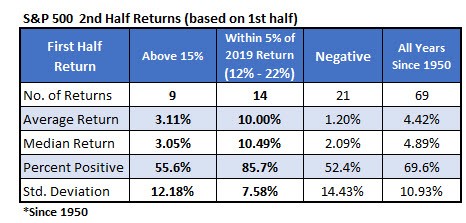
The table below summarizes second half returns of the S&P 500 based on how it performed in the first half of the year. The first column shows the returns after the first half simply gains 15% or more.
he 3.1% average return and 56% positive underperforms typical years, shown in the last column. Those numbers, however, are skewed by a couple of years which had abnormally huge first half returns which led to bad second halves. I’ll show those years soon, but when you take out those years it leaves seven returns in which the index averages a gain of 7.4% in the second half with five of the seven returns positive.
Those outlier returns are why I included the second column in the table. That column summarizes the second half based on when the first half finishes somewhere in the vicinity of this year’s return (specifically, it’s this year plus/minus 5%). In those 14 instances, the second half has been very strong. The next six months have averaged a double-digit return with over 85% of the returns positive.
The second half has tended to underperform when the first half is weak, so it seems the second half tends continue the momentum of the first half whether that momentum is up or down.
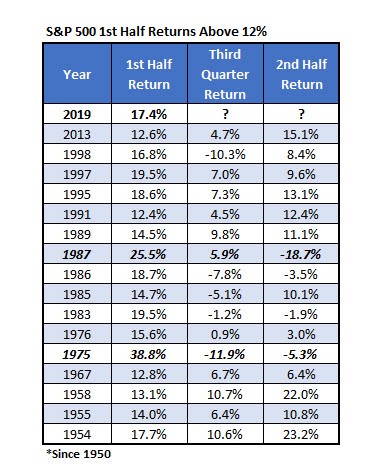
For those curious, the table below lists the specific years in which the S&P 500 gained 12% or more through the first six months of the year.
A lot of Positive Days
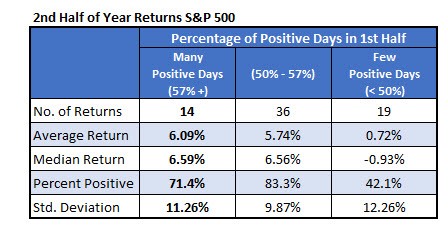
This year has seen an extremely high number of up days compared to other years. Specifically, 59% of the days were positive in the first half of 2019, which ranks ninth out of 69 years since 1950. The last time it was higher, and the only time since the financial crisis, was 2013, when 60% of the days were positive. The S&P 500 Index gained 15% in the second half of that year. The table below shows second half returns based on the percentage of up days through June of each year.
The extremely high number of up days has led to outperformance in the past. The returns are similar enough, though, to years where there were moderately high number of up days. When the index sees very few positive days in a half year, it has been a good indicator of underperformance going forward.
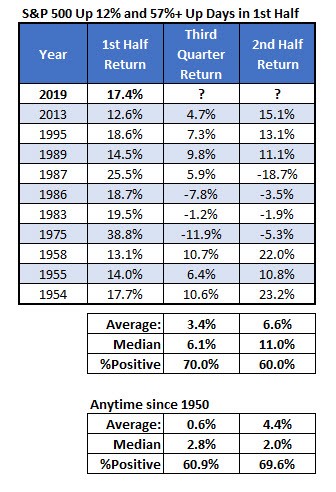
Adding it all up
The table below shows the years since 1950 in which the index was up at least 12% in the first half of the year and the percentage of positive days was at least 57%. It gives us 10 years of data. The third quarter has historically been a weak quarter. In these instances, however, the returns are bullish. The second half returns are less impressive compared to typical returns, but still average 6.6% compared to the typical 4.4% return in the second half. It’s encouraging that the last three times this situation has occurred, it’s led to double-digit returns in the second half of the year.