
The QuantCycles Oscillator for ADM has turned bullish just ADM has reached extreme oversold territory, reports John Rawlins.
The recent massive selloff in equities has affected all sectors. One company hit particularly hard in recent days has been agriculture giant Archer Daniels Midland Co. (ADM). ADM is unique in that it has not participated in the bull equity move of 2019.
It weakened along with the broader market in Q4 2018 and after a brief rebound, never participated in the rally. Weakness in the ag sector related to the ongoing trade war with China has been an anchor on ADM, but most of that weakness is priced in, especially with the recent spat of threats and counter threats between President Trump and the Chinese. With China restricting purchases of U.S. grains, there is not a lot of additional bad news that can hit the sector.
The recent weakness in ADM has moved it near oversold territory in the long-term QuantCycles Oscillator (see chart).
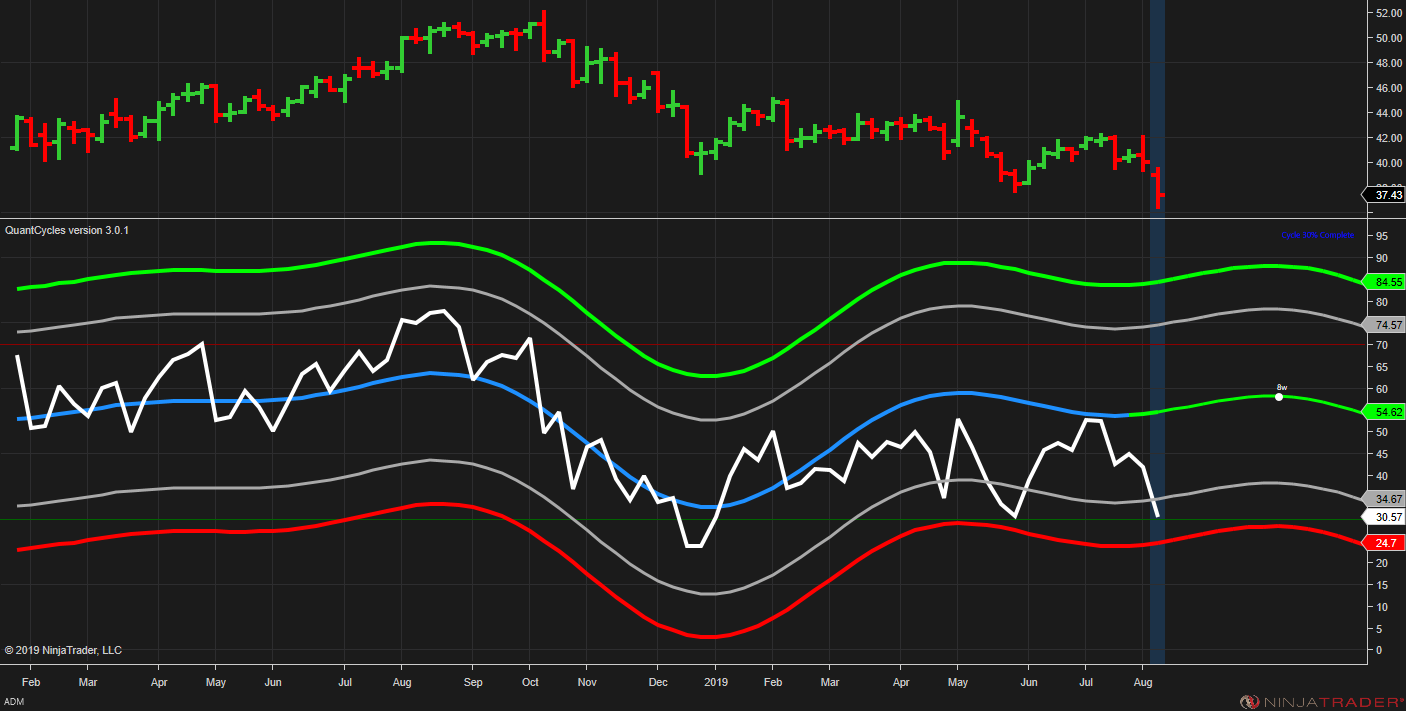
As you can see, the weekly oscillator is turning mildly higher as ADM near oversold levels.
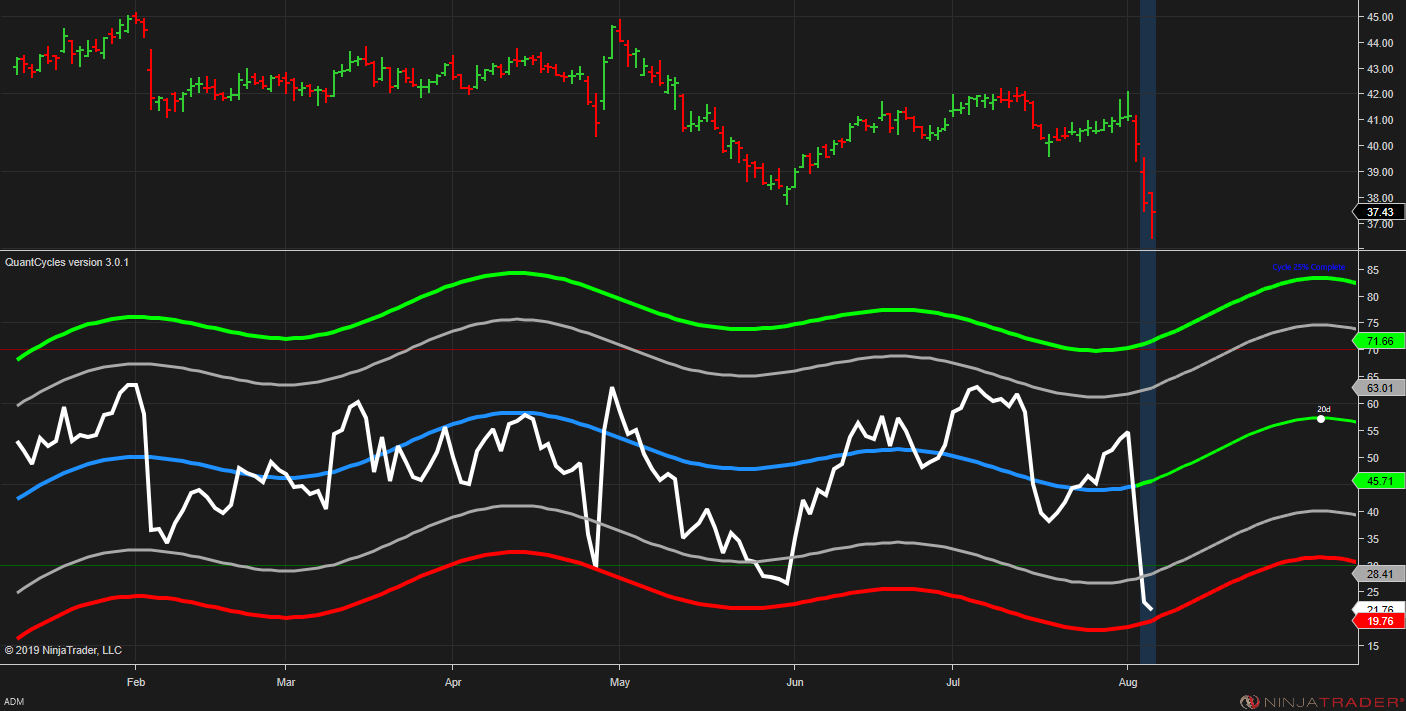
This becomes more dramatic when looking at the daily oscillator. As you can see in the chart below the daily QuantCycles turned up just as the recent equity market turmoil hit, pushing the daily oscillator near extreme oversold territory. This is a strong buy signal.
Digging into the short-term, there appears to be an opportunity to go long ADM. The four-hour chart shows that ADM pushed through extreme oversold territory and may already have set a near-term low.
This appears to be a strong bull sign for ADM. Given the weak fundamental outlook for the sector, it may be wise to utilize call options in any long play. But as we noted above, most of the bad news is already priced in and ADM may be due for a technical bounce. Given the extent of the recent weakness, this corrected bounce could be significant.
John Rawlins described the value of the QuantCycles Oscillator recently at The Orlando MoneyShow.
The QuantCycles indicator is a technical tool that employs proprietary statistical techniques and complex algorithms to filter multiple cycles from historical data, combines them to obtain cyclical information from price data and then gives a graphical representation of their predictive behavior (center line forecast). Other proprietary frequency techniques are then employed to obtain the cycles embedded in the prices. The upper and lower bands of the oscillator represent a two-standard deviation move from the predictive price band and are indicative of extreme overbought/oversold conditions.


