
The recent yield curve inversion may or may not signal a recession in the distant future, more importantly it confirms profitable trends that traders can exploit, writes Landon Whaley.
You could’ve played one hell of a drinking game last week by taking a shot of your favorite libation every time you heard the phrase “inverted yield curve.”
Bloomberg proclaimed, “Yield Curves Invert in U.S., U.K. as ‘Doom and Gloom’ Spreads.” CNBC displayed their own fear-mongering with, “Main yield curve inverts as two-year yield tops 10-year rate, triggering recession warning.”
Let’s peel back the narrative and take a look at the data-dependent reality of the yield curve and what an inversion really means for U.S.-based markets.
The media makes it sound like every time the two-year/10-year Treasury note yield curve inverts we experience a recession. With last week’s development, everyone and their mother is now predicting the U.S. is close to boarding that long black recessionary train.
What most people don’t understand is that it’s not an inversion of the yield curve that one needs to heed. Instead, it’s the hockey stick in the curve (resulting from tightening liquidity conditions) that occurs after the inversion that matters most; check out the two-year/10-year chart below.
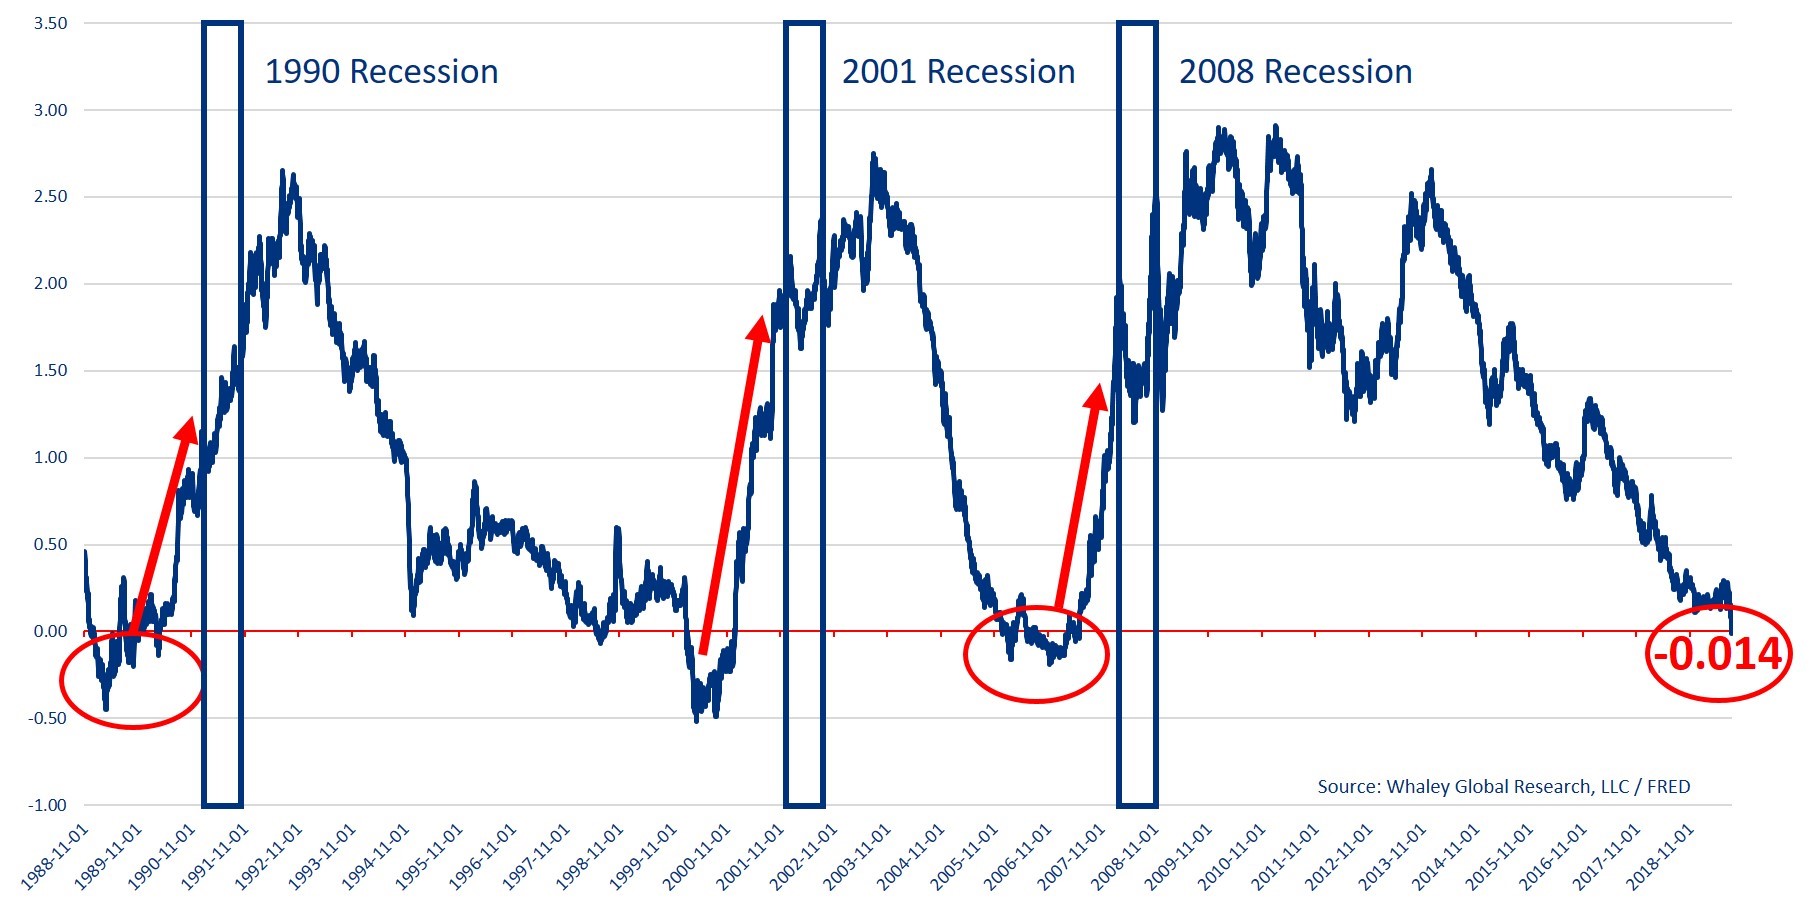
Even if the inversion is a harbinger of recessions, the average time from an inversion in the yield curve to a U.S. recession is longer than “Police Squad!” was on the air. Since 1988, the yield curve has inverted for a meaningful duration on three separate occasions: December 1988, February 2000 and June 2006. After those three inversions, it took an average of 780 days for a U.S. recession to appear.
That said, economic data is non-periodic, so you can’t use historical averages to make timing calls but suffice it to say that even if this latest yield curve inversion is signaling trouble ahead, you’ve got plenty of time to recession-proof your portfolio.
Let the fearmongers wield the inverted yield curve. Ignore them, and instead focus on positioning your portfolio to take advantage of market opportunities, whether the yield curve continues to invert or not and whether we plunge into an economic ice age, or not.
Long-dated U.S. Treasuries
Beginning in 1988, the first yield curve inversion of significant duration lasted six months from December 1988 to June 1989, and long-dated U.S. Treasuries gained 9.6%. The second inversion lasted 10 months from February 2000 to December 2000, and long-dated Treasuries gained 12.1%. The third inversion also lasted 10 months from June 2006 to March 2007, and long-dated Treasuries gained 8.9%.
Not only are the returns more than palatable and equity-esque, but the average peak-to-trough drawdown experienced during these inversions was just 4.1%. With an average gain of 10.1%, the reward-to-risk ratio is more than 2-to-1 in favor of the upside. Take that stock market junkie.
Utes
During the 1989 inversion, U.S. utilities gained 13.0% with just a 6.3% drawdown. During the 2000 inversion, utilities gained a whopping 40.8% while experiencing a 16.1% maximum drawdown. And finally, in the 10-month inversion from June 2006 to March 2007, utilities put up a 27.4% gain with just a 5.0% drawdown. With an average gain of 27.1% and an average drawdown of 9.1%, the reward-to-risk ratio is approximately 3-to-1 in favor of the upside. Utilities are the very definition of low risk, high reward when the concerning inverted yield curve makes an appearance.
REITs
Treasuries and utilities aren’t the only asset classes that enjoy a good inversion; Real-estate Investment Trusts (REITs) are bullishly inclined in that environment as well. During the 1989 inversion, U.S. REITs gained 8.3% with just a 0.3% drawdown. During the 2000 inversion, REITs rallied a healthy 22.4% while experiencing a 9.9% maximum drawdown. And finally, in the 10-month inversion from 2006 to 2007, they rallied 27.7% with a 12.6% drawdown. With an average gain of 19.5% and an average drawdown of 7.6%, the reward-to-risk ratio is 2.5-to-1 in favor of the upside.
Behaviorally Speaking
If the returns that utilities (+26.6%), REITs (+21.5%), and Treasuries (+25%) have delivered since we initiated bullish calls last year aren’t enough to convince you, and if the historical analog of their performance during past inversions doesn’t have you ready to pull the bullish trigger, then maybe the current Behavioral Gravity will seal the deal.
Most U.S. equity sectors, and style factors have been selling off since the overall market peaked on July 26. However, since that market top, utilities have gained an additional 2.1%, REITs have rallied 3.2%, and long-dated Treasuries are knocking the cover off the ball gaining 11.3%.
Despite this outperformance, investors are still bearishly inclined towards all three markets, and they’re actually net short across all durations of U.S. Treasuries. Folks, there is no better opportunity than when the Behavioral Gravity for a given market diverges from the Fundamental Gravity.
The “Headline Risk” bottom line is don’t let fearmongers scare you into believing that a yield curve inversion means it’s time to build a bunker loaded with canned food and ammo. The reality of a yield curve inversion is that it’s another bullish catalyst for markets we already like on the long side because of our U.S. Shift Work macro theme and the U.S. Winter Fundamental Gravity.
Please click here and sign up to receive the latest edition our research reports as well as to participate in a four-week free trial of our research offering, which consists of two weekly reports: Gravitational Edge and The Weekender.


