
The QuantCycles Oscillator shows that equities are oversold, but have more long-term weakness to work through, notes John Rawlins.
As you all know, expansion of Coronavirus cases created a dramatic sell-off in stocks earlier this week.
While information surrounding the virus has been in the public and had some traders concerned, it did not impact the bullish outlook on the market. Equities continued to climb a wall of worry. At least until new over the weekend that indicated that the Coronavirus could be worse than we initially were told.
We thought it was a good time to see what the QuantCycle Oscillator is showing on equities.
The Nasdaq 100 daily oscillator (below) looks a bit like you would suspect, oversold.
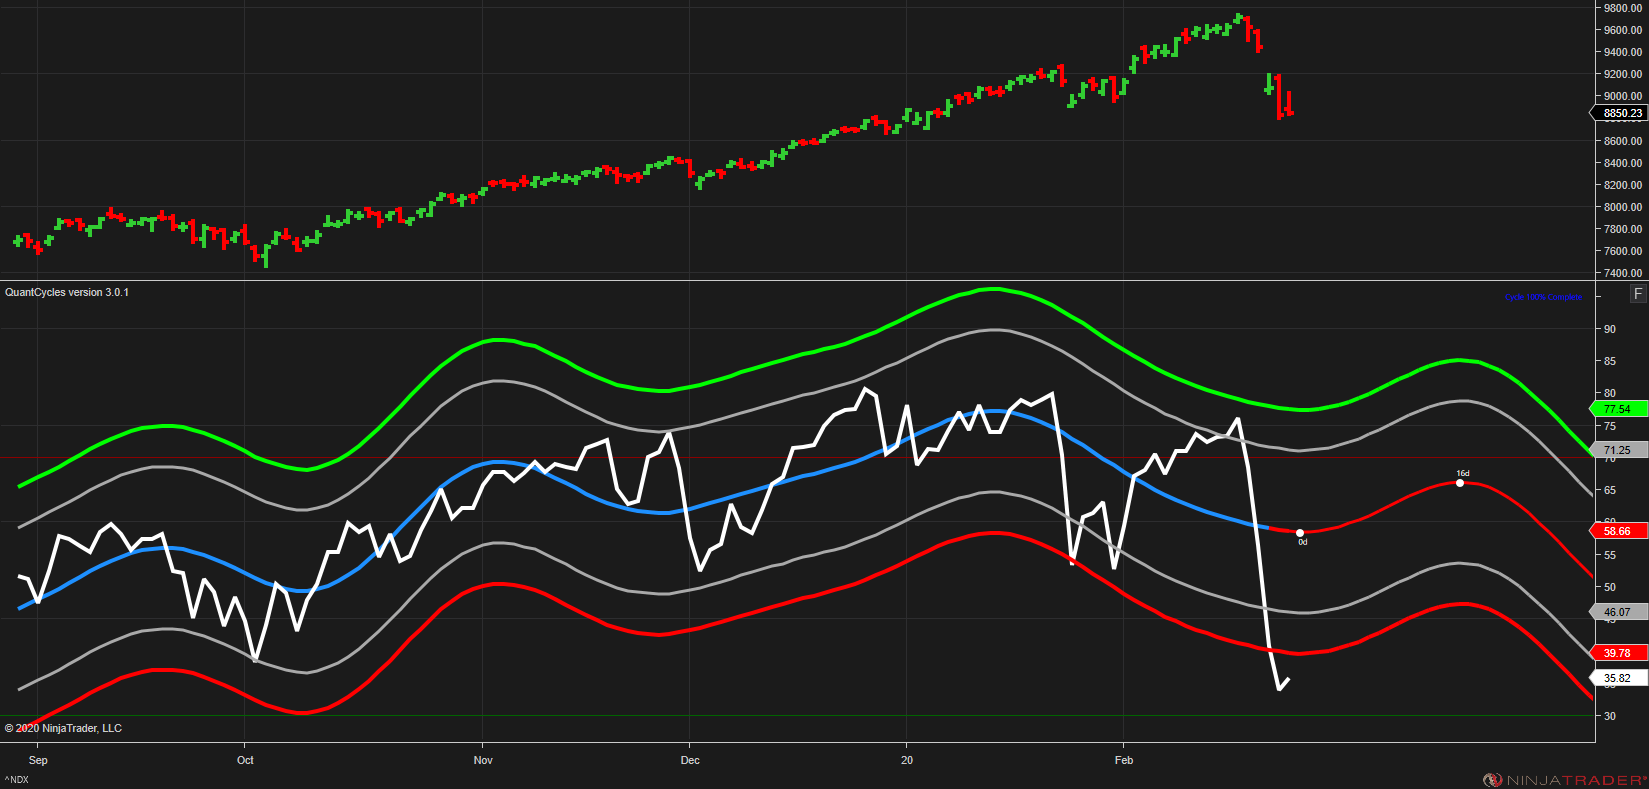
While looking at the above chart, one might want to get long, take a look at the Nasdaq 100 weekly (below).
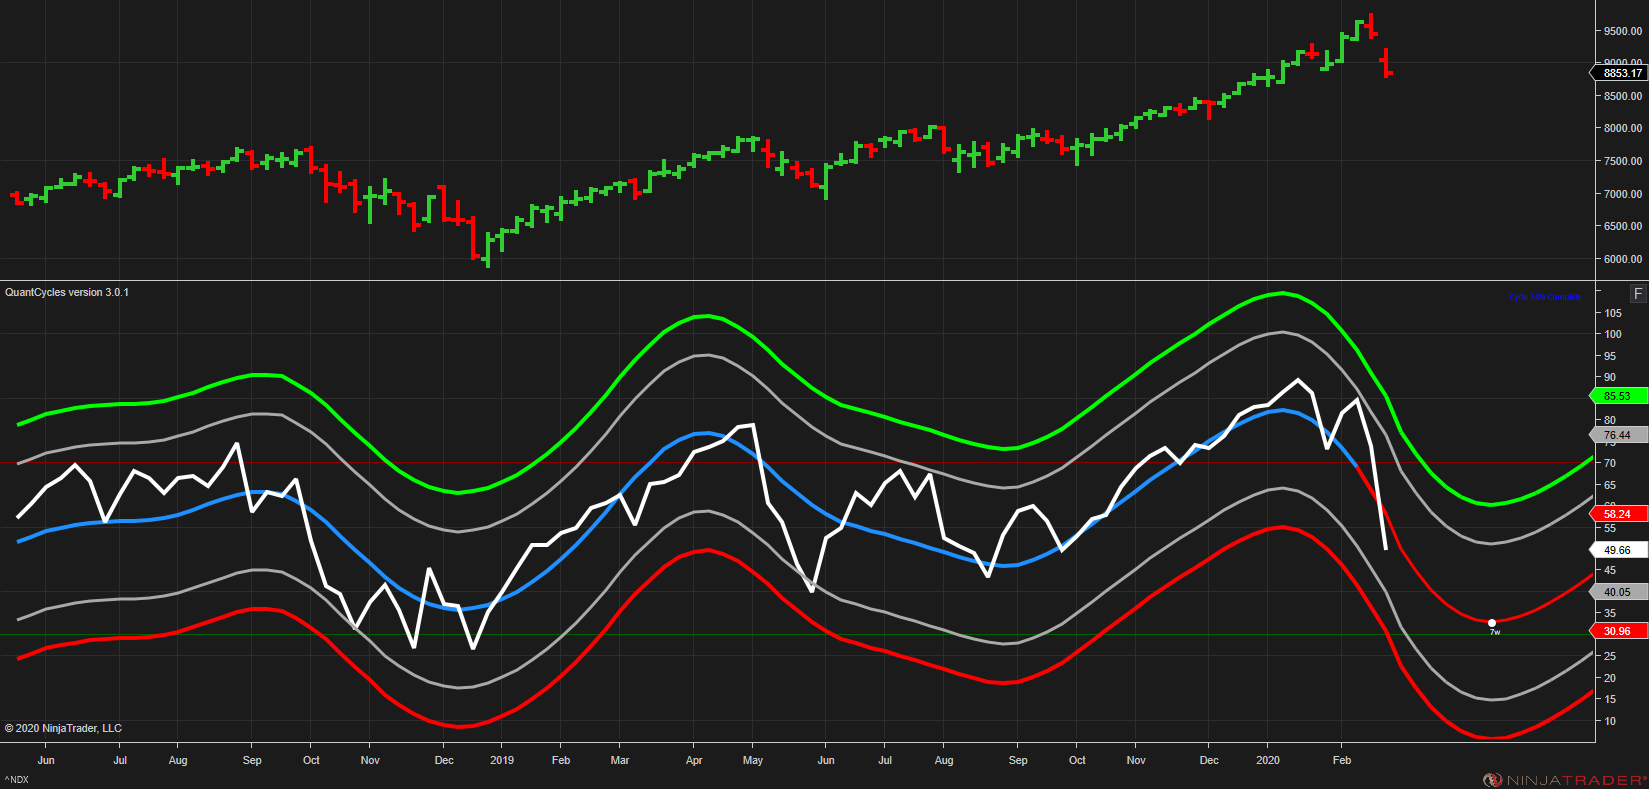
Clearly, there is a lot more downside to this move. It also shows that the markets dramatic reaction this week might have been more technical—after all we knew about Coronavirus for weeks and the increased cases didn’t justify the dramatic nature of the move. The market was clearly ready for a correction.
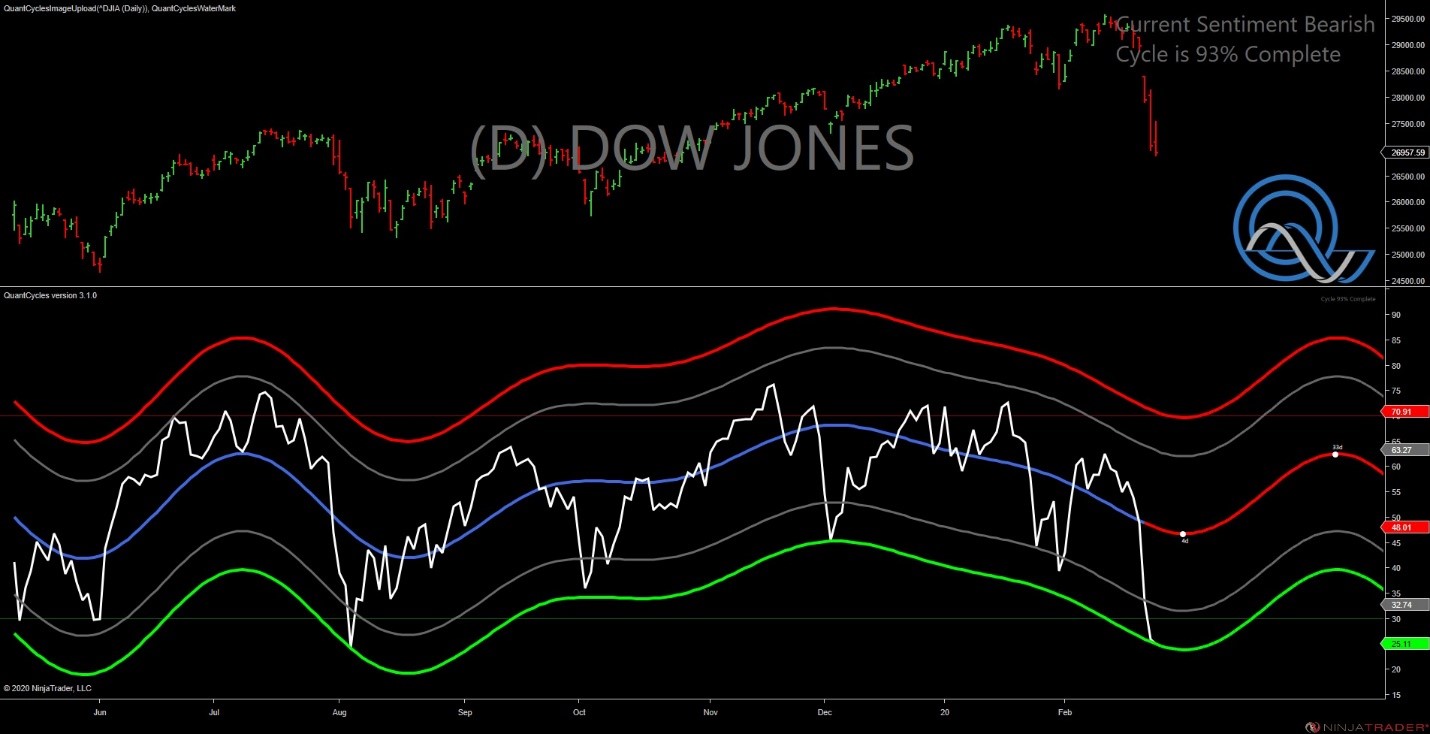
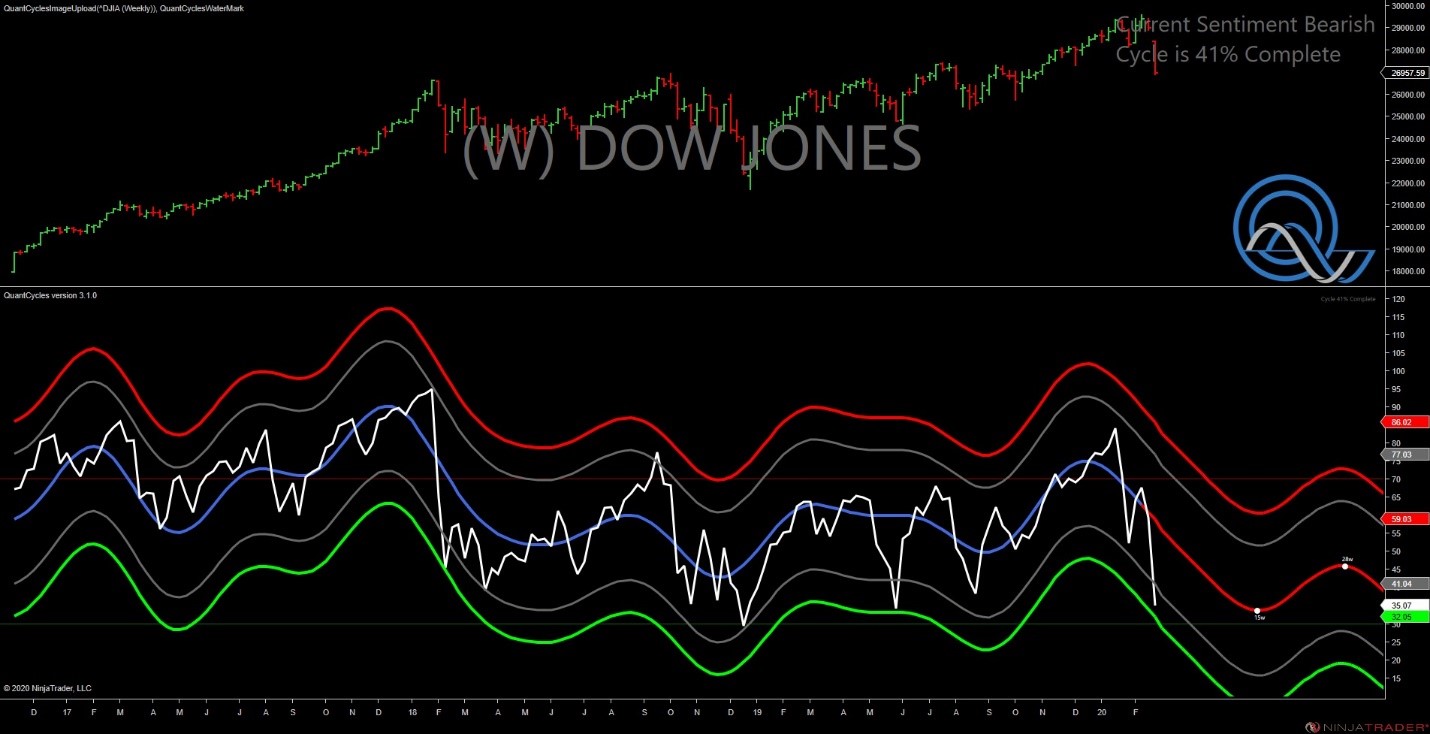
Looking at the daily and weekly charts in the Dow Jones Index, shows the same dynamic; extremely oversold in the daily but with a stronger long-term negative outlook.
What to Do
For those short-term traders willing to take on a few false starts, there certainly is opportunity going long for some short-term profits. But learn from what happened Wednesday. Equities began to rebound strongly, but further bad news pushed the equity indexes back to negative territory.
As for now the bear have the benefit of the doubt. You can go long but should probably bank any short-term profits and do not hold long positions overnight where it could be subject to bad news from overseas. And longer term traders should look at these rebounds as a way to get short at a better level.
John Rawlins described the value of the QuantCycles Oscillator recently at The Orlando MoneyShow.
The QuantCycles indicator is a technical tool that employs proprietary statistical techniques and complex algorithms to filter multiple cycles from historical data, combines them to obtain cyclical information from price data and then gives a graphical representation of their predictive behavior (center line forecast). Other proprietary frequency techniques are then employed to obtain the cycles embedded in the prices. The upper and lower bands of the oscillator represent a two-standard deviation move from the predictive price band and are indicative of extreme overbought/oversold conditions.


