
Several biotech and Pharmaceutical stocks are nearing technical breakouts, reports Suri Duddella
Biotech and pharmaceutical companies focus on the development of drugs for the treatment of infectious diseases and medical conditions. Due to the high demand for medicines and research, their stocks have been a great investment. Due to the Coronavirus pandemic, many big pharma stocks such as Johnson and Johnson (JNJ), Bristol-Myers Squibb Co. (BMY), Pfizer Inc. (PFE) and Merck & Co. Inc. (MRK) have underperformed in 2020 compared to some generic pharmaceutical stocks like Dr. Reddy’s Laboratories (RDY) and Teva Pharmaceutical Industries (TEVA).
Here we present a few pharma stocks nearing key breakout levels in Cup & Handle patterns.
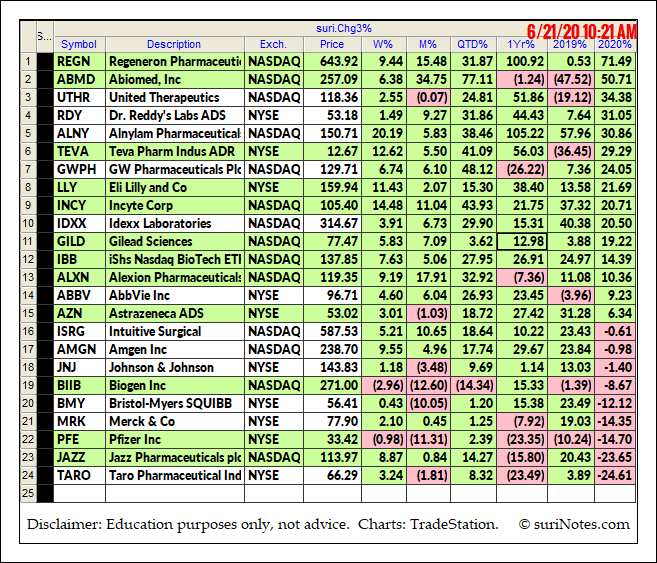
Below is a list of the leading Biotech and Pharmaceutical Stocks and their year to date performances.
Cup & Handle Patterns
The Cup and Handle Chart pattern was developed and popularized by William J. O’Neil in the 1980s through his CANSLIM methodology, Investors’ Business Daily articles, and his book "How to Make Money in Stocks."
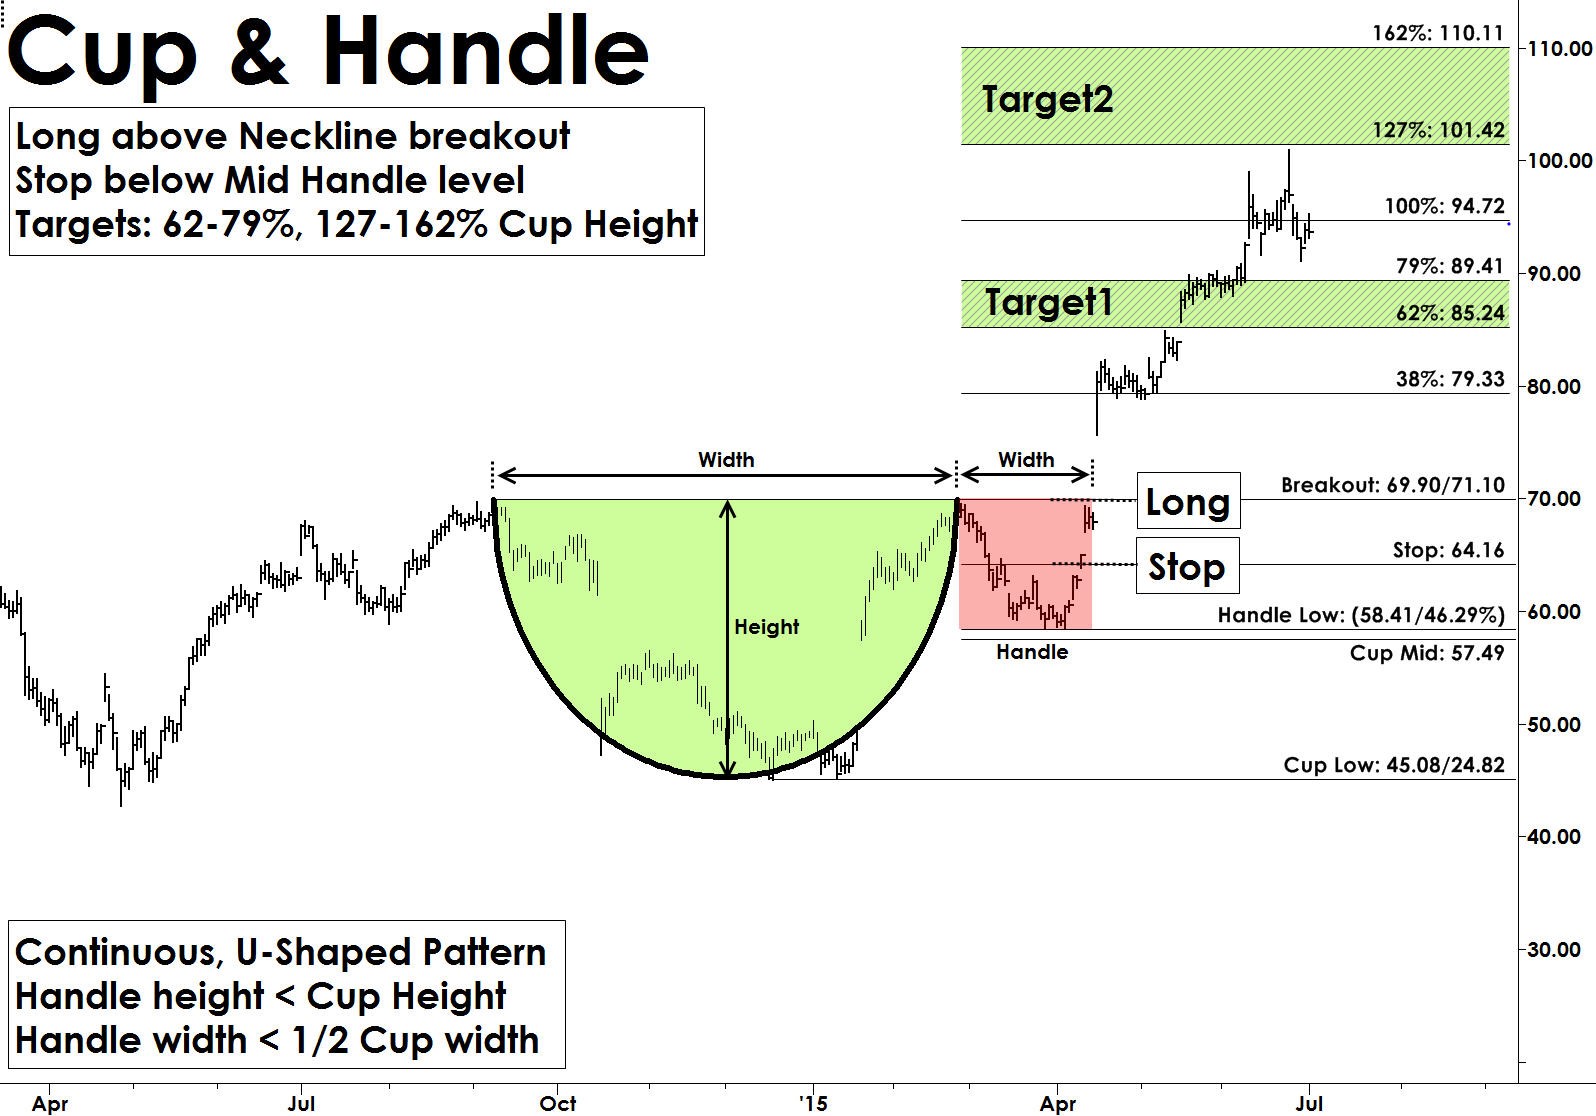
Cup and Handle patterns resemble a Cup with a Handle. It is a continuation pattern that usually forms in bullish trends. Most Cup and Handle patterns are very reliable and offer great trading opportunities. They also form in all markets and in all time-frames. The “Cup” formation is developed as a consolidation phase during price rallies from the round bottom formation over multiple weeks to months. The “Handle” part forms due to a price correction after “Cup” formation and before a clear breakout to the upside.
Cup and Handle pattern structure shows the momentum pause after reaching a new high in a U-Shape form, followed by another attempt to breakout. When this breakout from the rim of the cup fails it starts to fall back to build the "Handle" structure. Usually, the handle structures are small, and the handle depth should not exceed more than 50% of cup depth. This handle part of the pattern generates.
GW Pharmaceuticals Plc
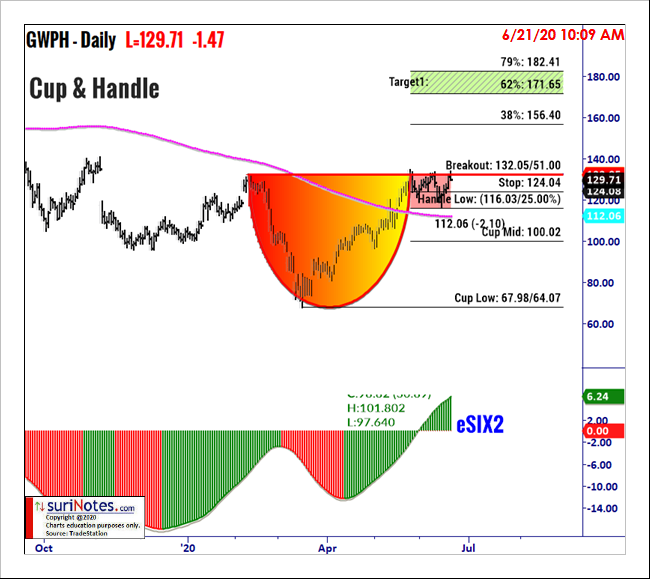
GW Pharmaceuticals Plc (GWPH) has formed a Cup and Handle pattern on its daily chart and is trading near the breakout level of $132.15 (see below). A trade is only signaled when price closes above the breakout level. GWPH pattern's mid cup Level is $100.02, and handle low is $116.03. After entering a trade above the breakout, a stop is placed below the low of the mid cup or handle. Targets are placed at $156.40, $171.6 and $182.4.
Johnson & Johnson
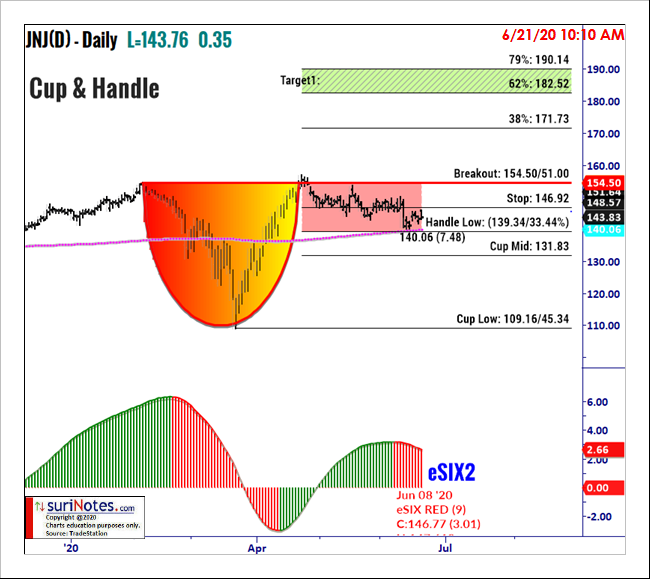
JNJ's daily chart is forming a Cup and Handle pattern on its daily chart and is trading below the breakout level of $154.60 (chart below). JNJ pattern's mid cup Level is $131.83, and the handle low is $139.34. After entering a trade above the breakout, a stop is placed below the low of the mid cup or handle. Targets are placed at $171.73, $182.50 and $190.10.
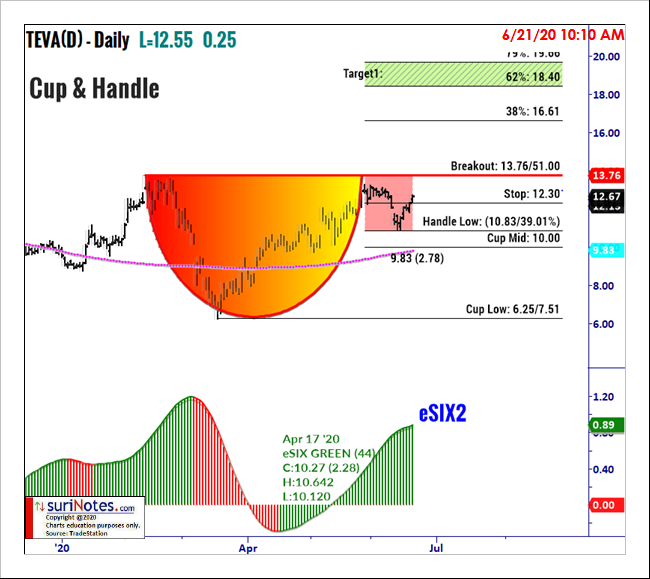
TEVA Pharmaceuticals
TEVA's is forming a Cup and Handle pattern on its daily chart and is trading below the breakout level of $13.86 (see below). The mid-cup level is $10 and handle low is $10.83. After entering a trade above breakout, a stop is placed. Targets are $16.61, $18.40 and $19.70.
Watch Suri’s archived presentation “How to Trade Chart Patterns With Market Context,” from Friday June 12 as part of the New MoneyShow Virtual Event. Find more of Suri’s work at surinotes.com.


