
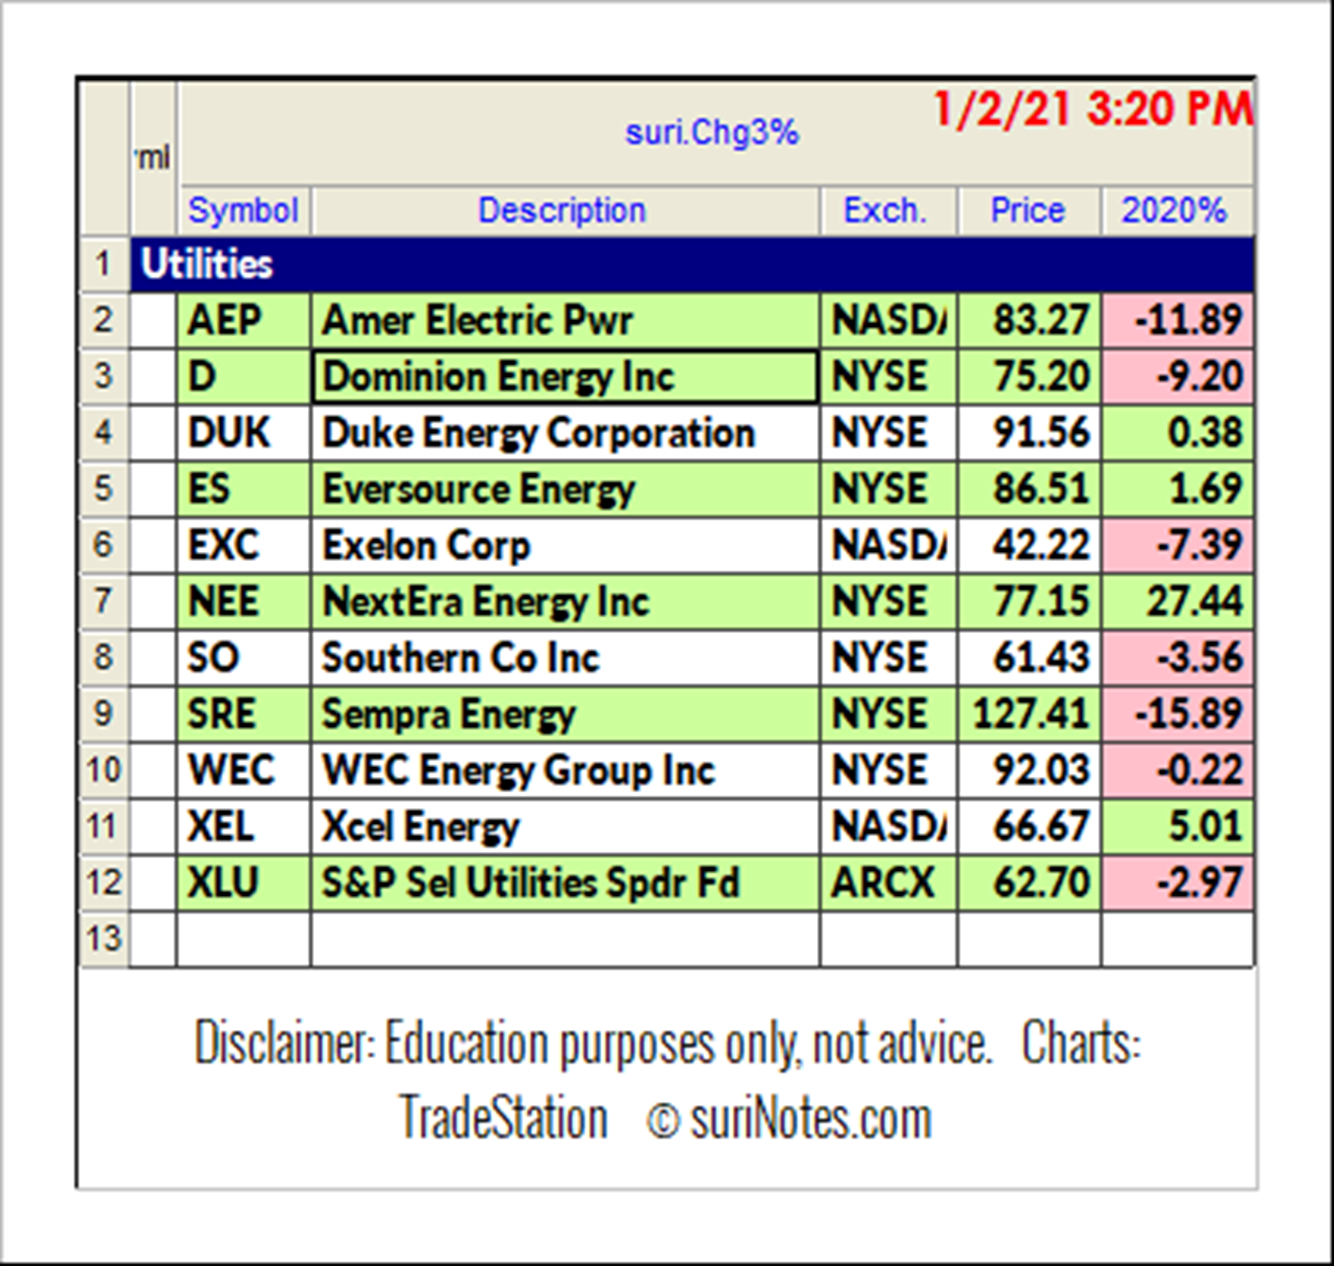
In 2020, the Utilities Select Sector SPDR ETF (XLU) had underperformed the S&P 500 Index ETF (SPY) by posting a -2.97% loss compared to the SPY (16.16%), states Suri Duddella of suriNotes.com.
However, in the last three quarters, utilities stocks have gained momentum and outperformed the Financial Select Sector SPDR (XLF). As the pandemic triggered stimulus measures and other developments become effective; the utilities sector stocks may bounce back from recent retracements. Here are some of the ABC bullish patterns currently forming in the utility stocks.
Select Utilities Stocks and Their 2020 Performance:
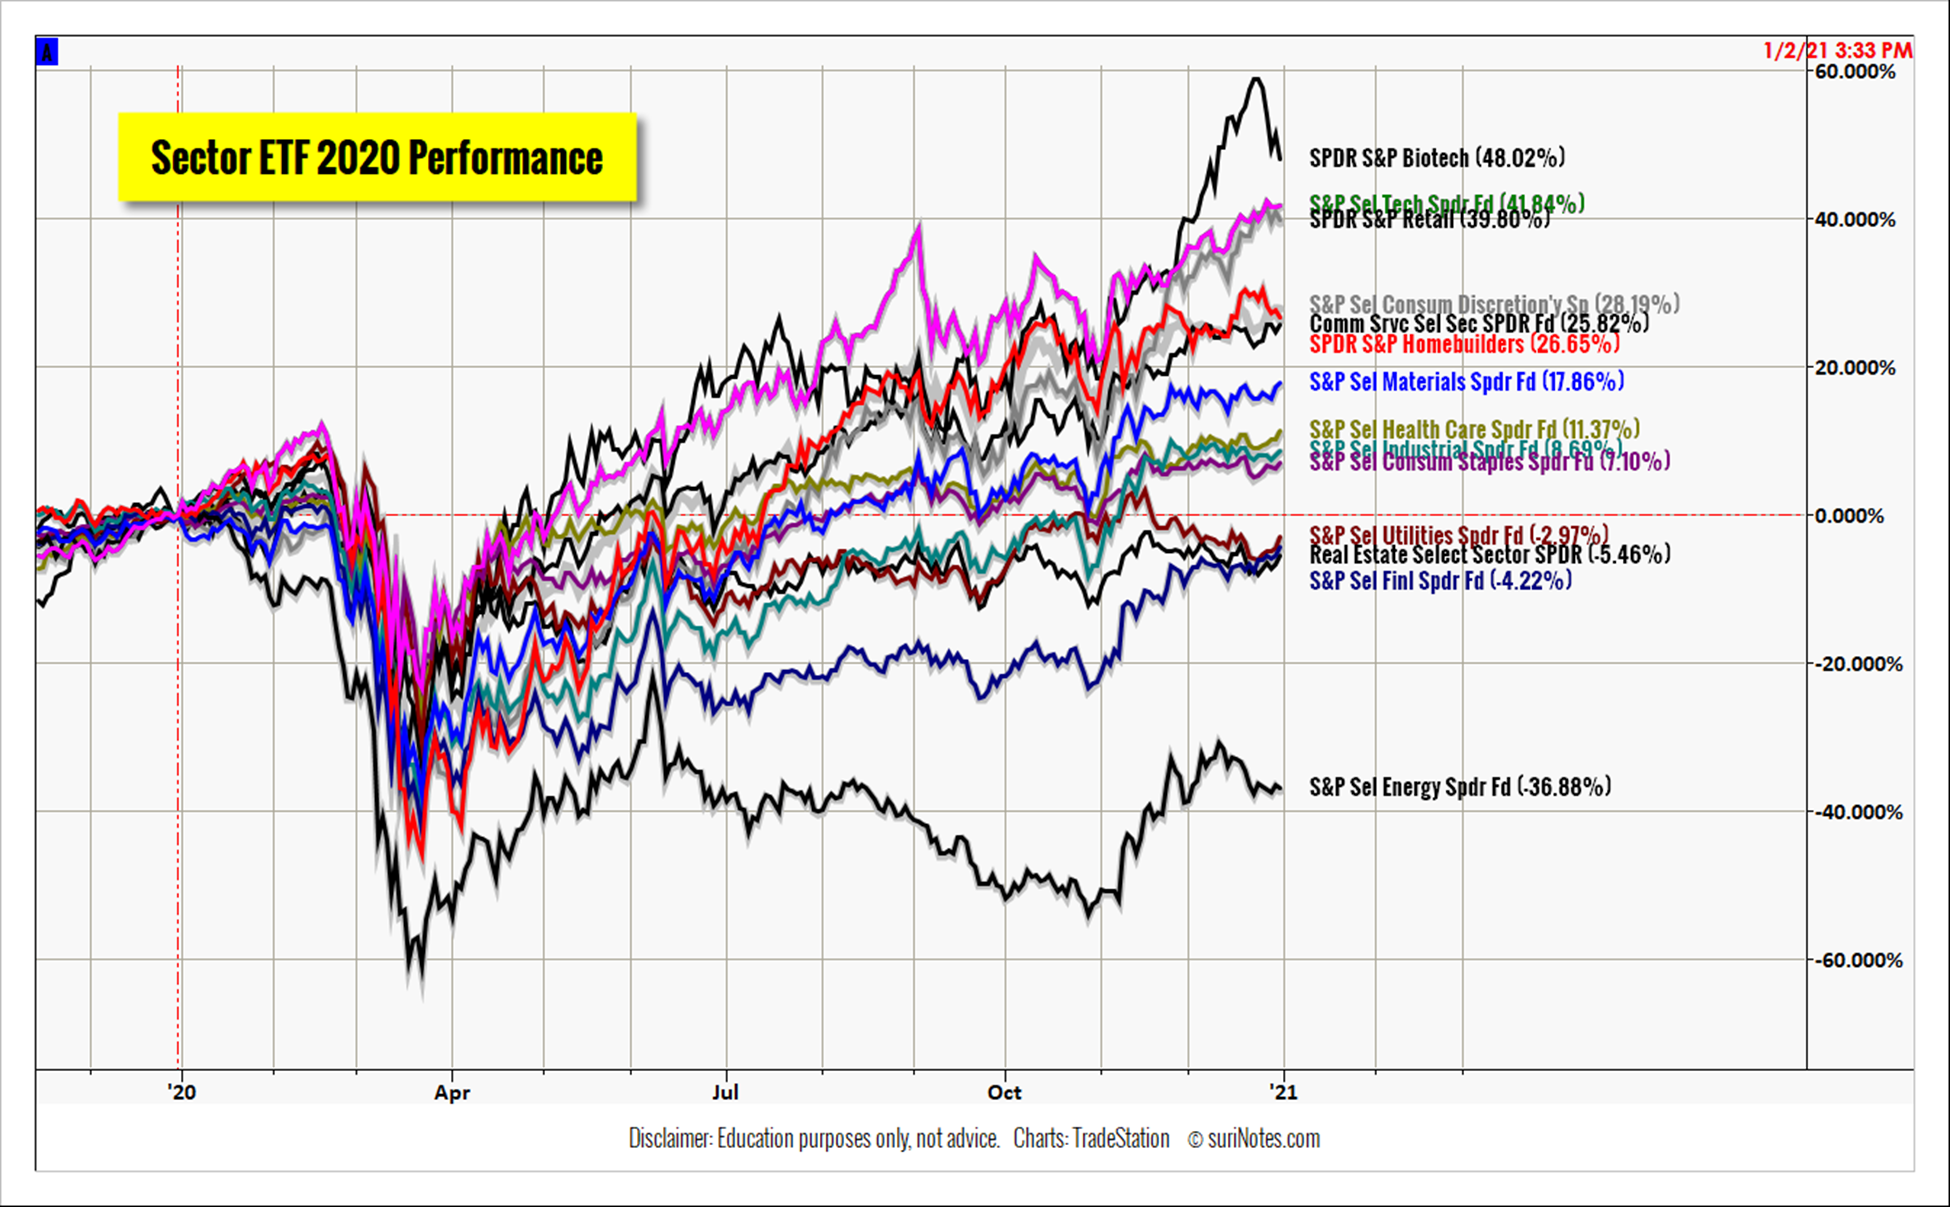
S&P Select Sector ETF 2020 Performances:
Trading ABC Patterns
The ABC chart pattern and its related AB=CD chart pattern are prime examples of "Symmetry" in the markets. These "Harmonic" patterns help traders to identify buying and selling opportunities in all markets and in all timeframes. The ABC and AB=CD patterns are first described by H.M. Gartley in his book Profits in the Stock Market (1935). The main advantages of trading harmonic patterns are that they allow traders to determine risk vs. reward ratios beforehand as they forecast key market turning points and profit targets for traders. The ABC pattern (can be a continuous or reversal pattern) and it is shaped like a lightning bolt.
Identification
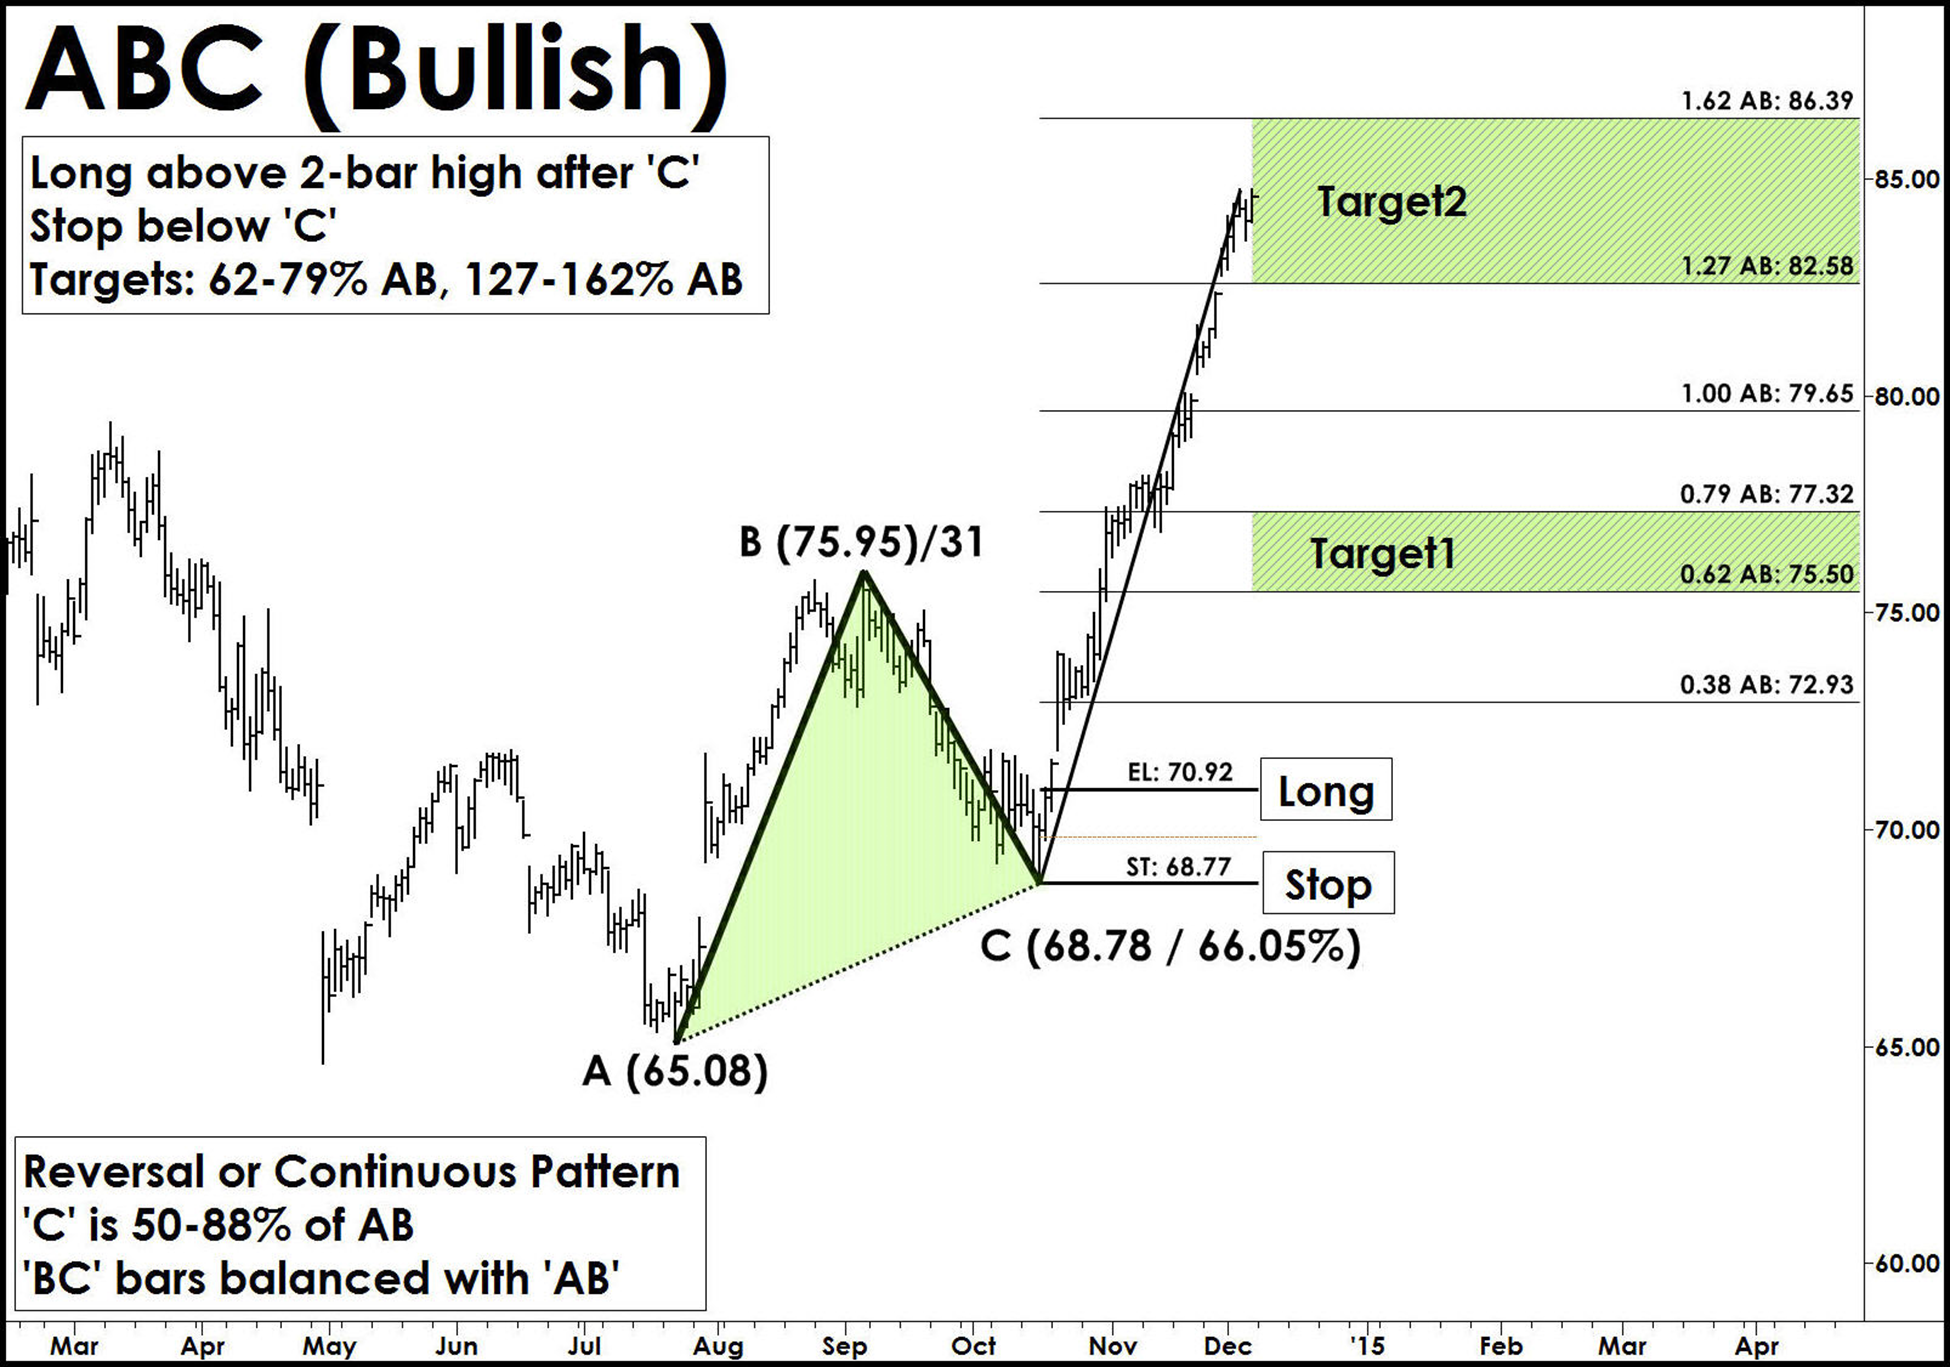
The following chart show ABC bullish pattern formation and its trade information in TradeStation software.
Trade Entry:
After ABC pattern is completed, it is advisable to wait for the pattern to confirm a reversal signal using any momentum-based indicator or price confirmation mechanisms. Enter after a long trade above the Entry Level ('EL').
Stop:
A stop is placed few ticks below C (in bullish) or few ticks above C (in bearish) levels.
MoneyShow’s Top 100 Stocks for 2021
The top performing newsletter advisors and analyst are back, and they just released their best stock ideas for 2021. Subscribe to our free daily newsletter, Top Pros' Top Picks, and be among the first wave of investors to see our best stock ideas for the new year.
Targets:
The ABC pattern targets are computed using the AB and BC swings. The height pattern (AB) is used to project target levels from C-level using fib. ratios. The first target zone is (62-79% AB) from 'C' and second target zone is (127-162% AB). A secondary target level is set at 100% AB Level.
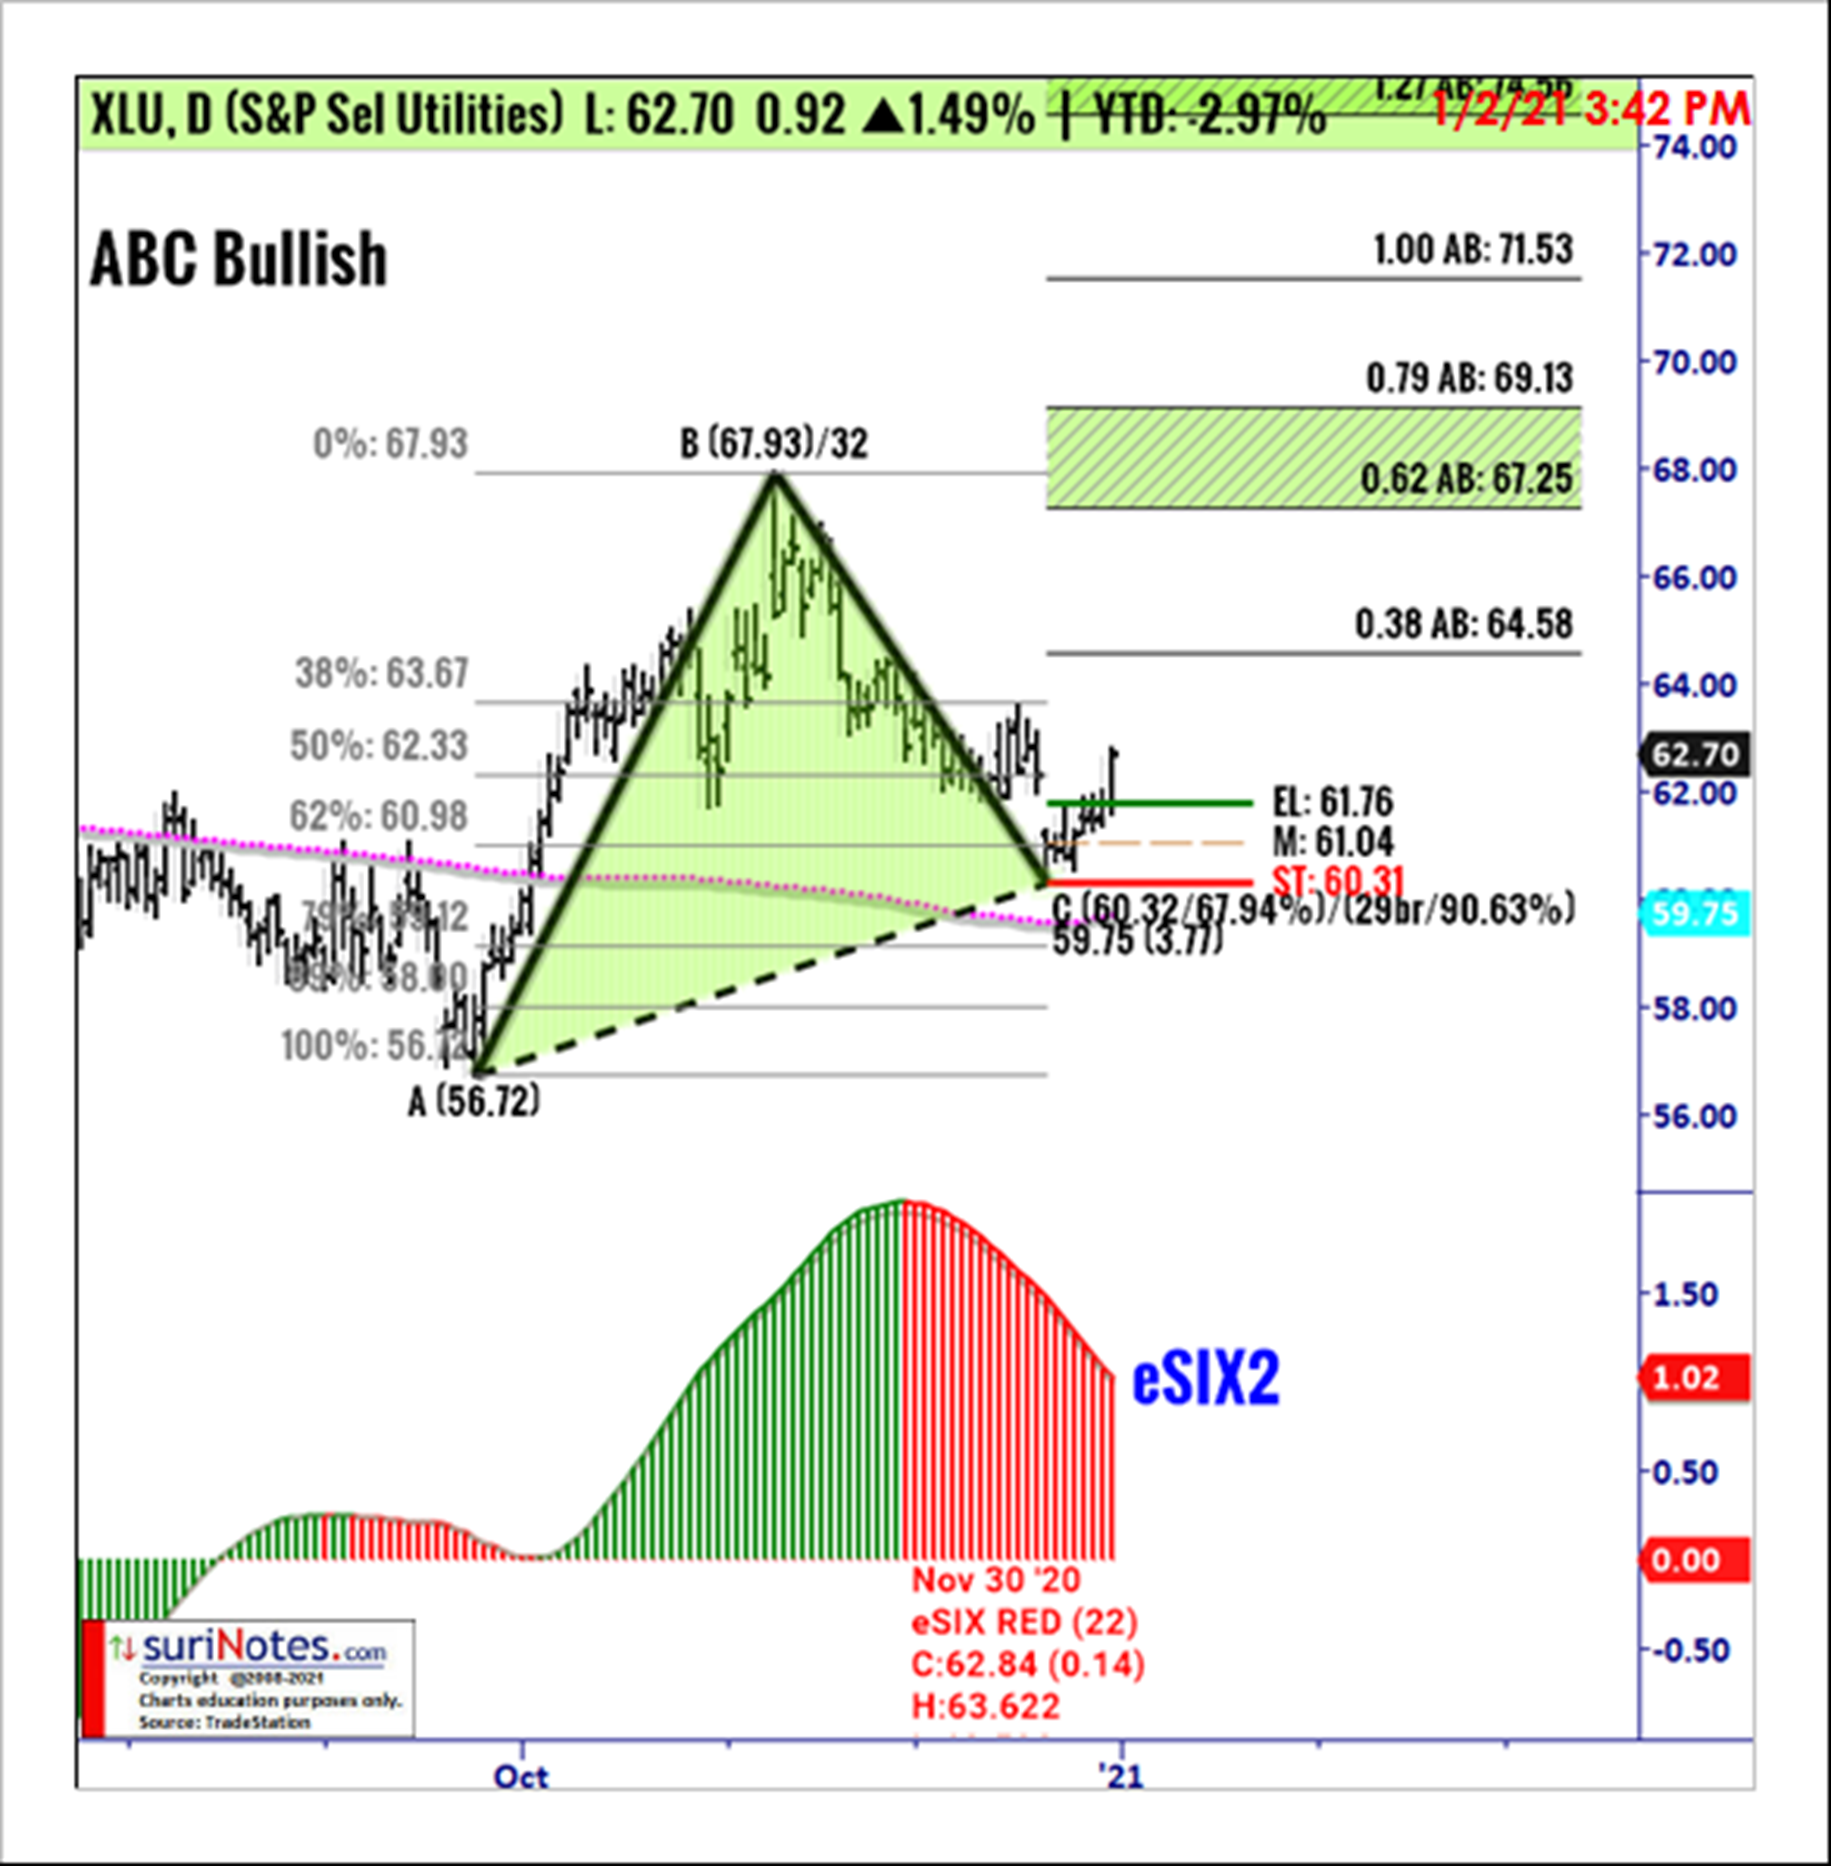
S&P Select Utilities SPDR ETF ABC Bullish Pattern
S&P Select Utilities SPDR ETF (XLU) is trading in ABC bullish pattern on its daily chart above the long entry-level of $61.86. ABC bullish patterns are valid only when the price closes above the entry-level with the confirmed-up trend. Enter a long trade above entry-level with a stop below $60.31 (-$1.45). Targets are placed at Target1 Zone $67.2 to $69.1 and, Target2 Zone $74.6 to $78.5.
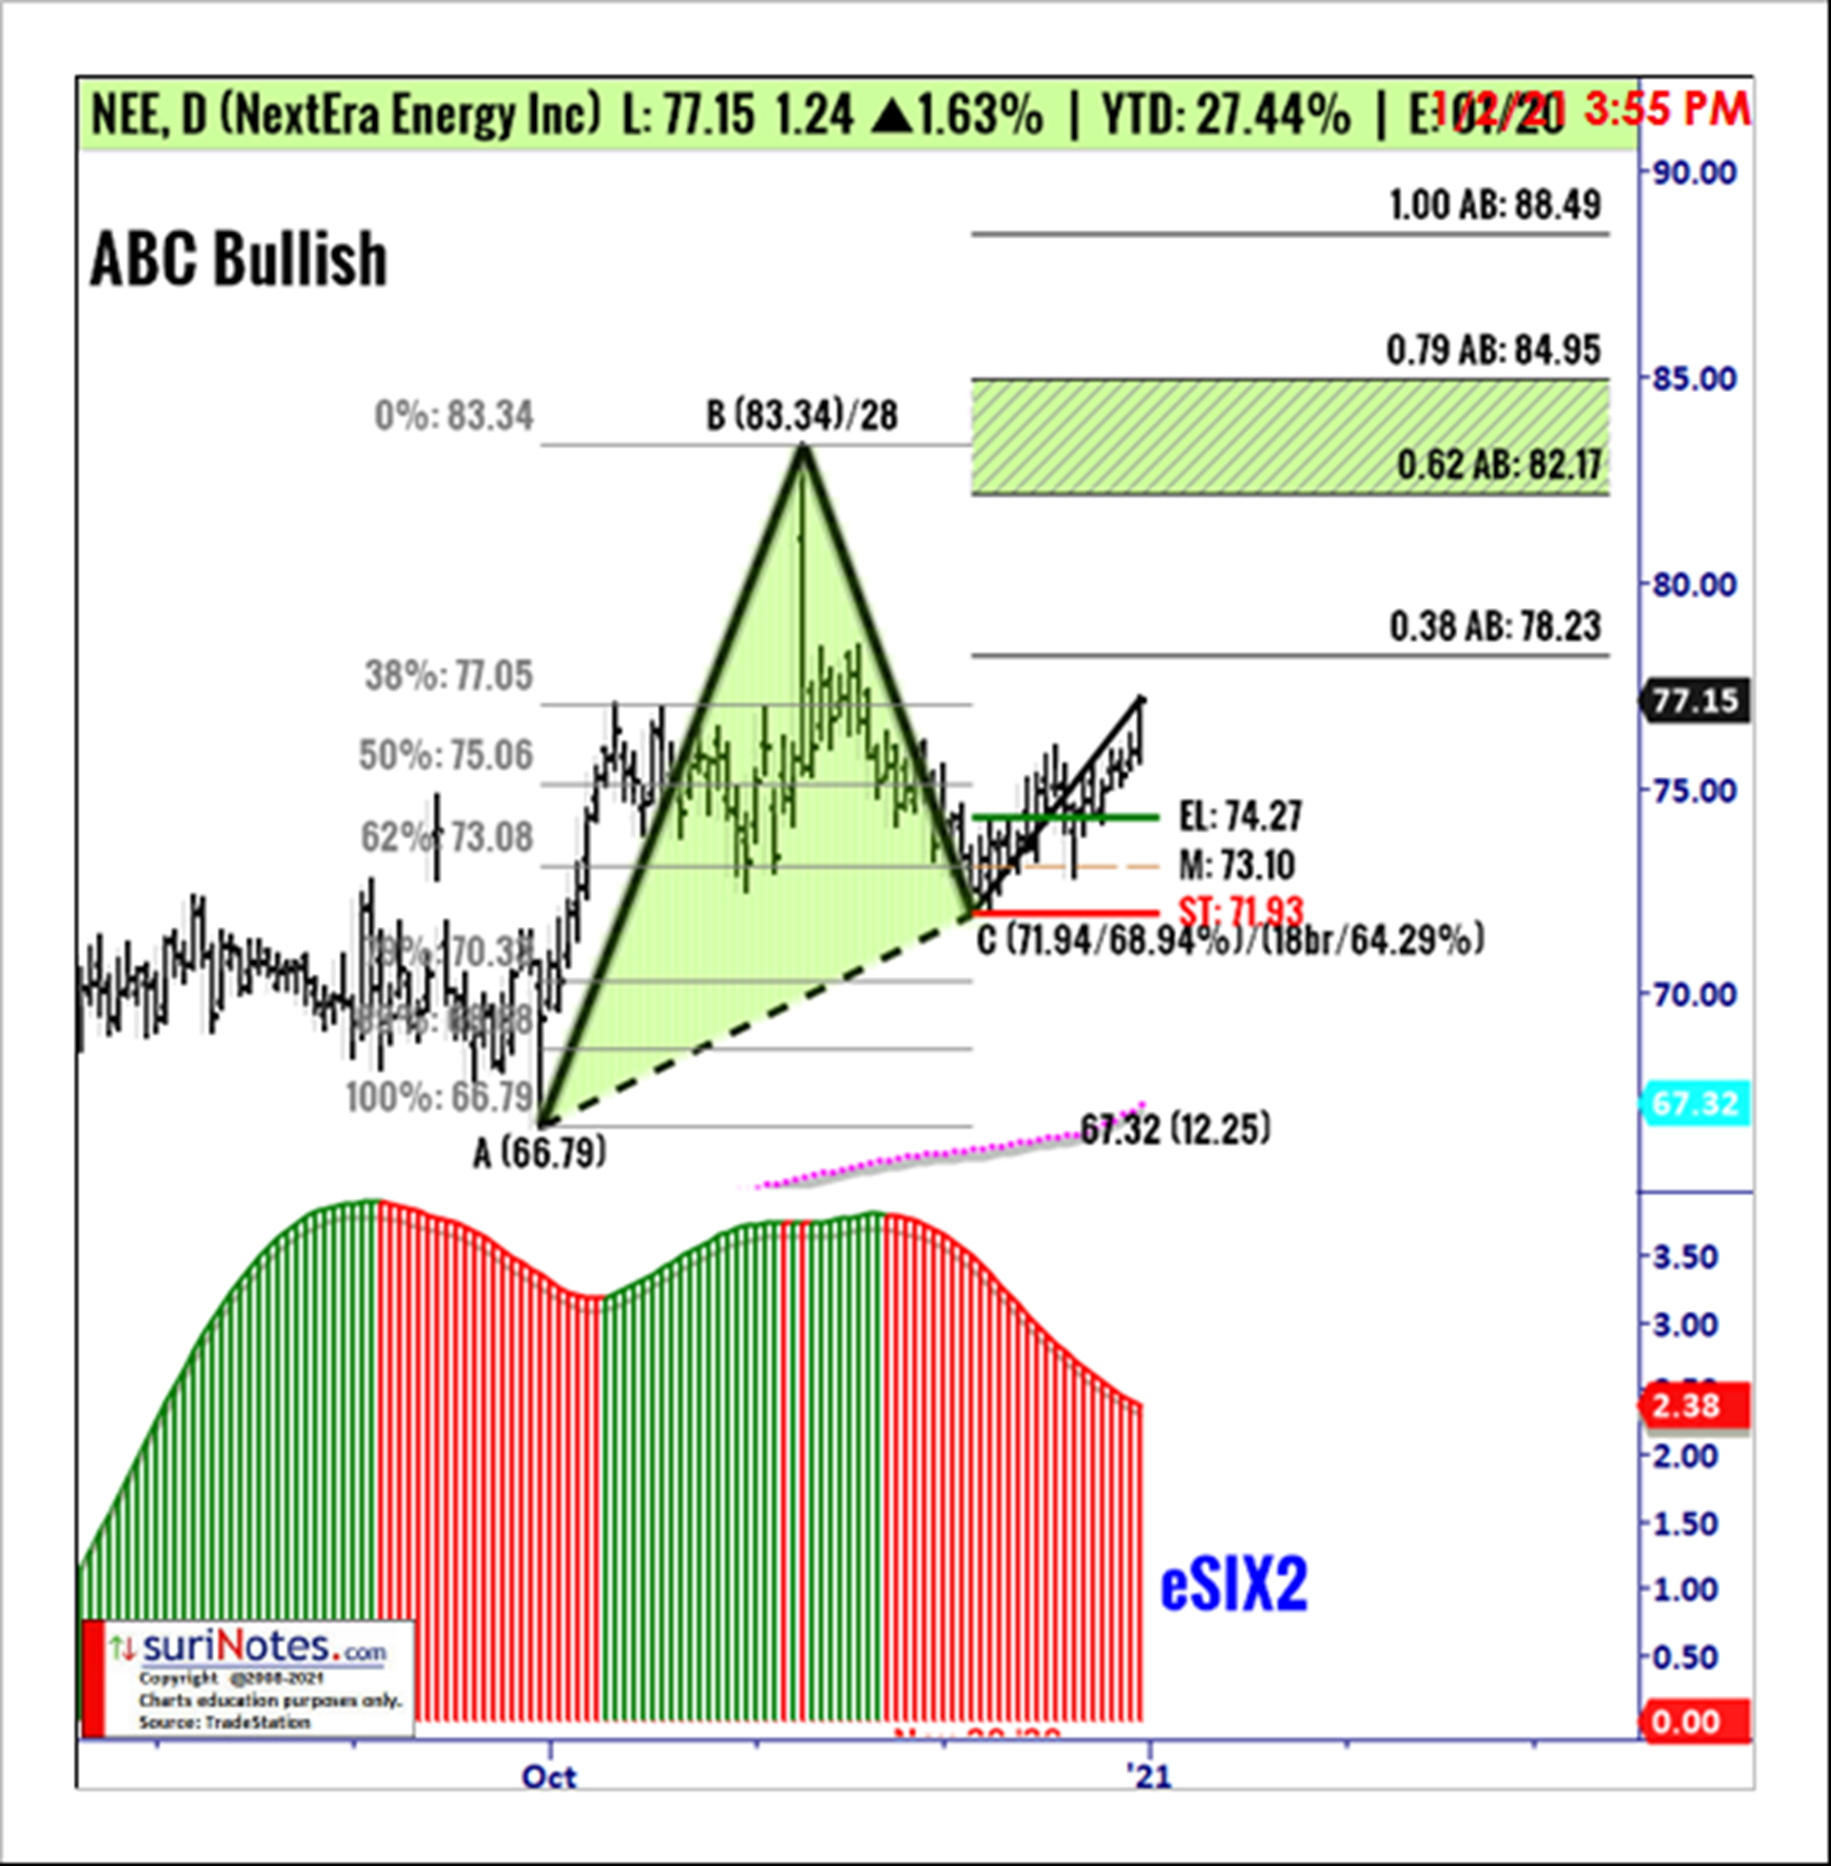
NextEra Energy Inc ABC Bullish Pattern
NextEra Energy Inc (NEE) is trading in ABC bullish pattern on its daily chart above the long entry-level of $74.37. ABC bullish patterns are valid only when the price closes above the entry level with the confirmed-up trend. Enter a long trade above entry-level with a stop below $71.93 (-$2.34). Targets are placed at Target1 Zone $82.2 to $84.9 and, Target2 Zone $93.0 to $98.8.
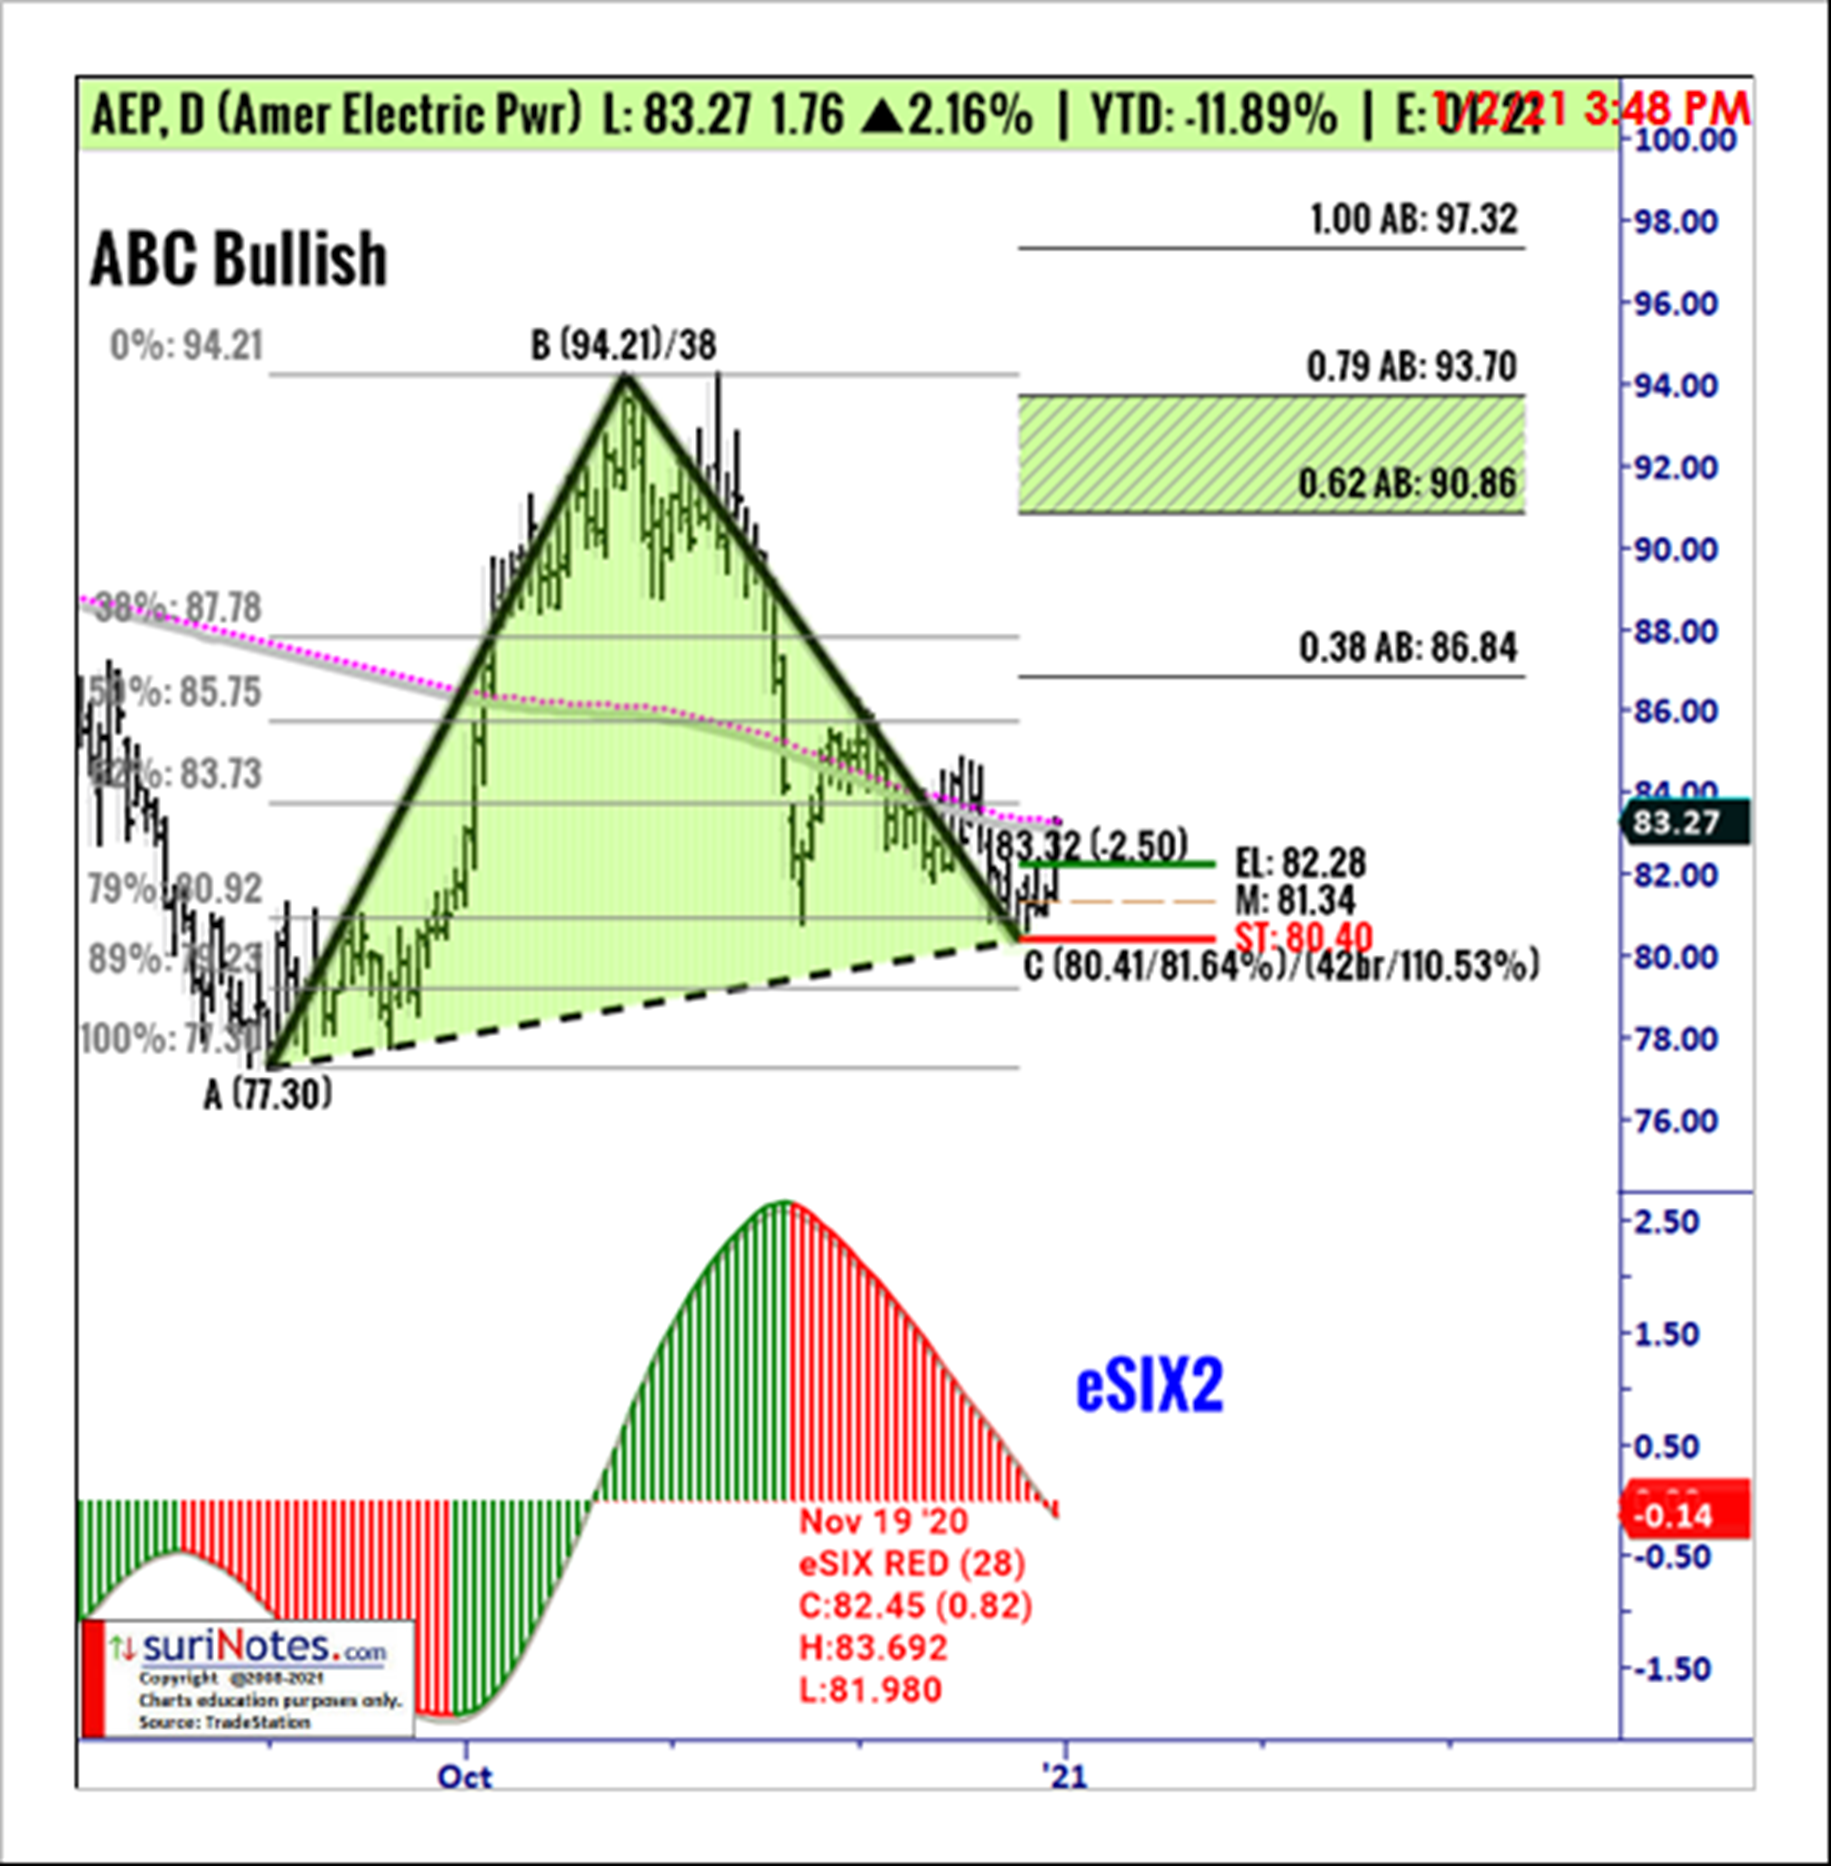
Amer Electric Pwr ABC Bullish Pattern
Amer Electric Pwr (AEP) is trading in ABC bullish pattern on its daily chart above the long entry-level of $82.38. ABC bullish patterns are valid only when the price closes above the entry level with the confirmed-up trend. Enter a long trade above entry-level with a stop below $80.40 (-$1.88). Targets are placed at Target1 Zone $90.9 to $93.7 and, Target2 Zone $101.9 to $107.8.
To learn more about Suri Duddella, please visit SuriNotes.com.


