
These 10 best price action trading patterns are my favorites, and successful traders use these patterns everyday to make money, shares Al Brooks of BrooksTradingCourse.com.
Be flexible because each has many variations. If you keep your mind open to all possibilities, you will begin to see them every day, in every market, and on every time frame.
Which is the best price action trading pattern for swing trading or for scalping? Which is the best for forex markets? What about for day traders or commodity trading? It does not matter because any pattern can be the best, depending on the chart in front of you.
Also, several might be present at the same time. For example, there can be a failed breakout above a bull channel at a measured move projection, and the breakout might have been out of a triangle. Some traders would call it a final flag reversal, others might see a major trend reversal, and some would concentrate on the failed channel breakout.
The key is to understand what forces are behind the price action patterns and be ready to trade them as you see them unfold.
Major Trend Reversals
A bull trend is a series of higher lows and highs, and a bear trend is a series of lower highs and lows. Trading a major trend reversal pattern is an attempt to enter at the start of a new trend, hoping that a series of trending highs and lows will follow.
Since traders are entering before the new trend is clear, the probability of even the best-looking setup is usually only 40%. These traders are looking for low risk (a tight stop), but that almost always comes with low probability. The math is good for both these early-entry traders and for those who wait for the strong breakout into a clear trend. The components of a major trend reversal include a:
- Trend
- Pullback that breaks out of channel
- Resumption of the trend
- 2nd pullback that grows into opposite trend
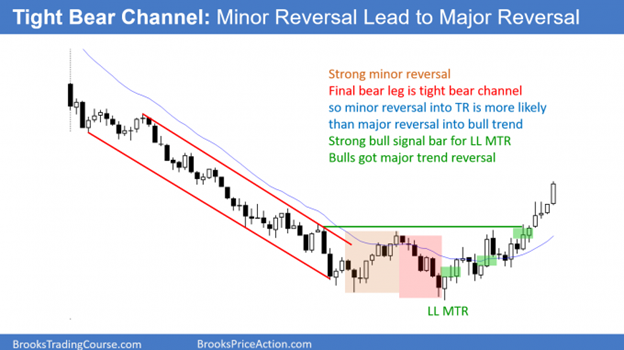
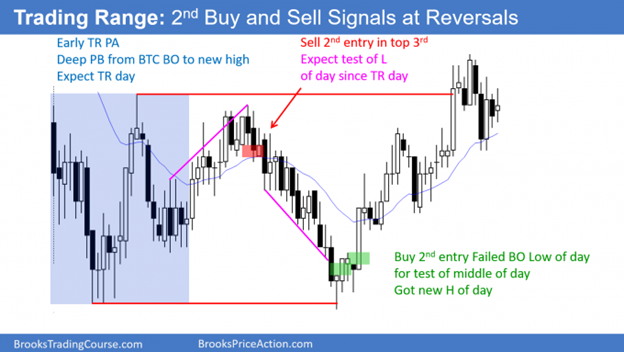
First breakout above a tight bear channel is typically minor. The 2nd reversal has a 40% chance of being major, like here. Buy above a bull bar closing near its high (green rectangle).
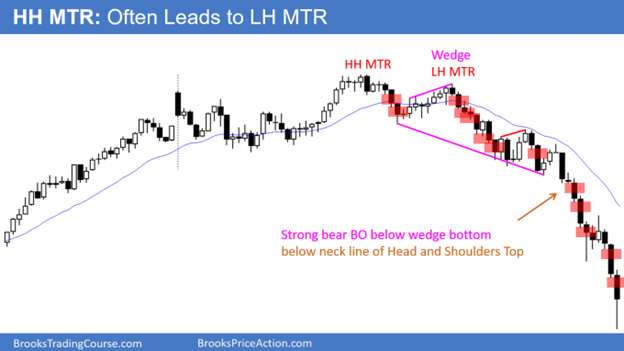
A reversal down from a breakout above a bull flag (here, a triangle) is often a higher high major trend reversal. Sell below a bear bar closing near its low. A lower high major trend reversal frequently follows a higher high reversal. There were many opportunities to sell (red rectangle) below a bear bar in the bear trend. Traders do not take every sell signal.
However, they need to understand that the bears have taken control, and they should try to take at least one sell signal.
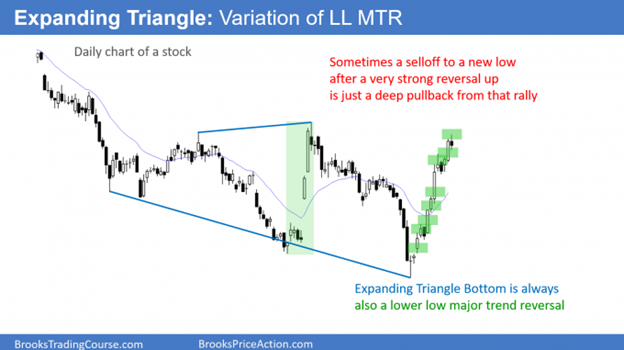
There was a very strong reversal up in the middle of the chart, but the bears got one more new low. Sometimes a new low can simply be a deep pullback from a strong rally, like here. Every expanding triangle bottom is also a lower low major trend reversal. There were many opportunities to buy above a bull bar closing near its high.
Final Flags
The components of a final flag are:
- Trend
- Pullback that is usually mostly horizontal. It can be as brief as a single bar
- Trend is typically close to a magnet (resistance in a bull, support in a bear)
- There are likely other signs of a possible reversal (in a bull, examples include building selling pressure near the top of a channel)
A final flag is a trend-reversal pattern that begins as a continuation pattern. Traders expect the continuation to fail and are ready to take a trade in the opposite direction.
Like all trend reversals, the probability of a swing is usually only about 40%. My general goal is 10 bars 2 legs, which means a swing that has at least ten bars and two legs (TBTL). A swing also means a reward that is at least twice as large as the risk (my minimum criterion for a successful swing).
Sixty percent of the trades result in small wins and losses that usually balance each other out. Traders who want a higher probability usually will wait for the reversal to have a strong breakout in the new direction. At that point, the probability of a swing trade is often 60% or more, but the stop is far away.
That increase in risk is the trade-off. There always has to be something in the trade for the institution taking the other side of your trade. If you get great probability, you pay for it with bad risk/reward (reduced reward relative to risk).
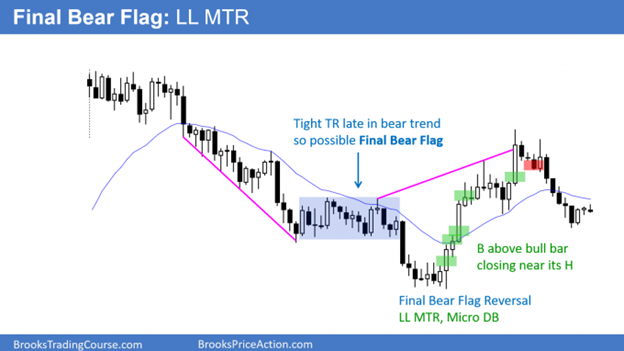
A tight trading range late in a bear trend is often the final bear flag. Traders will look for the breakout below to reverse up.
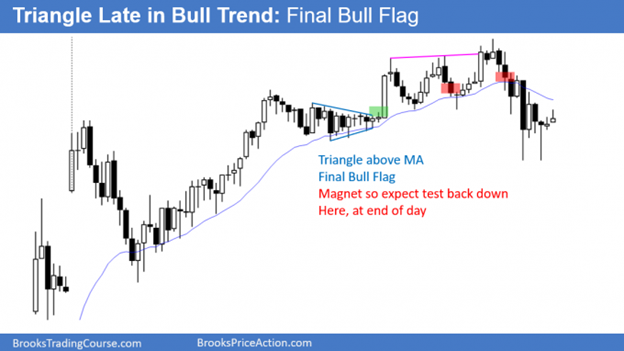
A triangle is a tight trading range. When it forms late in a bull trend, it usually is the final bull flag.
Breakouts
Breakout of what? Of any support or resistance. It does not matter. Every trend bar is a breakout of something, if only the high or low of the prior bar. With experience, traders begin to see what is truly being broken out.
The most common things are trading ranges, pullbacks, prior highs and lows, trend lines, channels, and moving averages. Sometimes traders need to switch to a higher time frame to see the breakout.
Among the 10 best price action trading patterns, breakouts are my favorite because I like high-probability trades.
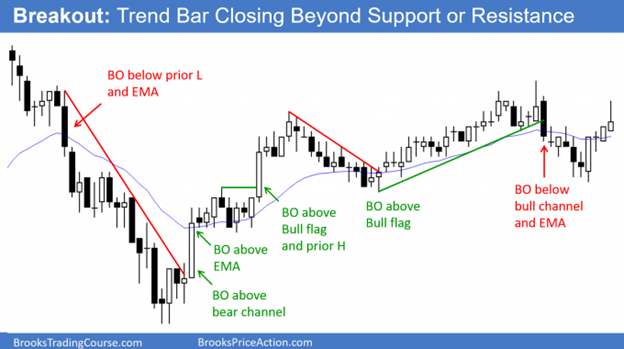
A breakout is simply a trend bar up or down. A breakout always closes beyond at least minor support or resistance. The bigger the bar and the more important the support or resistance, the more likely the trend will continue at least a little longer.
High 2 Bull Flags and Low 2 Bear Flags
Many traders find bar counting confusing because they want it to be perfect and clear. What they don’t understand is that the purpose of the market is to create confusion. It wants to spend as much time as possible at prices where both the bulls and bears feel that the price is fair. This facilitates trading, which is the reason why the market was created.
The basic idea of these flags is that the market often makes a couple attempts to reverse a trend, which creates two legs. If those two reversals attempts fail, the market usually tries to go in the other direction. Since the other direction is a trend and it is now resuming, the countertrend traders know they are in trouble and will be quick to exit once that second attempt fails.
They will also not be eager to try again. The result is a high-probability continuation pattern trade that usually moves quickly. Traders often scalp these setups, but when the trend is still strong, they can swing part or all of their position.
The patterns are often nested, with a smaller version forming in each of the two bigger legs. It does not matter whether a trader enters on the smaller version or the larger, as long as they use the correct swing stop.
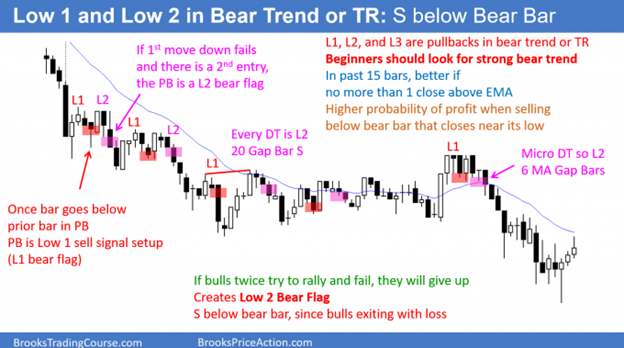
In a bear trend or a bear leg in a trading range, a one-legged pullback (small rally) is a Low 1 sell setup. If it triggers, but there is then one more leg in the pullback, it creates a
Low 2 bear flag. A Low 3 is either a triangle or a wedge (a triangle that is diagonal).
A double top is a Low 2 bear flag. Sometime the legs have many bars and subdivide into smaller patterns.
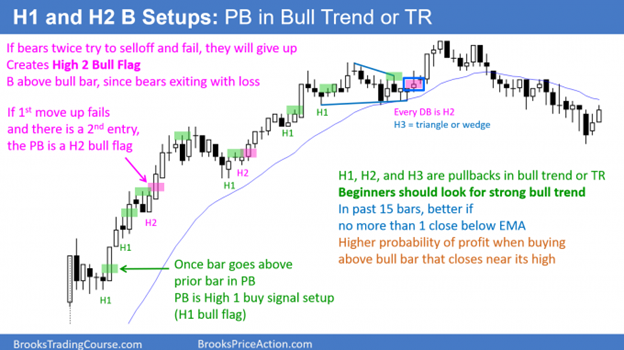
In a bull trend or a bull leg in a trading range, the first time the high of a bar is at or below the high of the prior bar, the pullback is a High 1 bull flag. If it triggers, but there is then one more leg down, that creates a High 2 bull flag. A triangle is a sideways High 3 bull flag, and a wedge bull flag is a triangle that is sloped down. Every small double bottom is a High 2 bull flag.
Wedges: Three Pushes Up or Down
The traditional definition of a wedge is a converging triangle that slopes up or down, and traders expect the breakout to be in the opposite direction of the slope. They look for an upside breakout of a wedge that is sloped down, and for a downside breakout of a wedge that is sloped up.
Wedges are continuation patterns when they are pullbacks within trends, and they are reversal patterns when they are large, and the context is right. When they are flags, they are small reversal patterns. For example, when there is a wedge pullback in a bull trend, the wedge is a small bear leg. Traders expect that bear leg to fail and to reverse up.
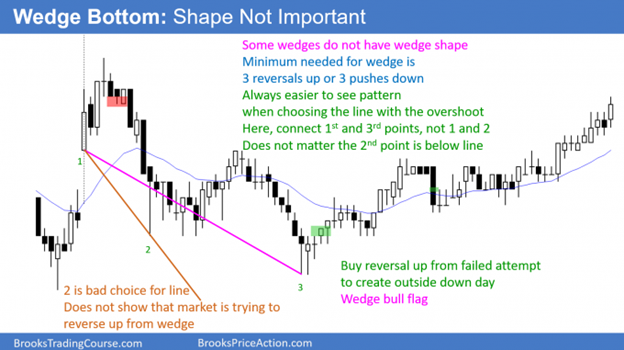
In the broadest sense, a wedge is any pattern with three (sometimes four or five) pushes that is sloped up or down. It does not have to be convergent, and the third push does not have to exceed the second.
As soon as there are two pushes, traders can draw a line connecting them and then they can extend the line to the right (a trend channel line). They will then watch for a reversal if the market approaches the line for a third time.
The closer any pattern is to ideal, the more reliable it is because more computers will treat it as significant. However, traders should never lose sight of the underlying forces and should learn to become comfortable with every conceivable variation of every pattern. This will give them far more trading opportunities.
A wedge top is a bull channel that is converging. Most wedge tops have 3 legs up, but some have a 4th and rarely a 5th. Traders sell below a bear bar closing near its low and expect at least 2 legs down. The legs often subdivide into smaller legs. Any bull channel should be viewed as a bear flag since there is a 75% chance of a break below the bull trend line.
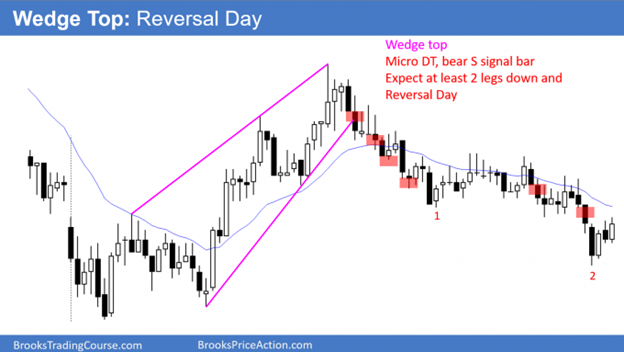
Wedges are rarely perfect, and most do not look like a textbook wedge. If a bear channel has 3 legs down, even if the channel does not have a wedge shape, view it as a wedge. The same forces are at work. The market is trying to go down repeatedly, but keeps reversing up. At some point, traders decide it needs to try the other direction (up).
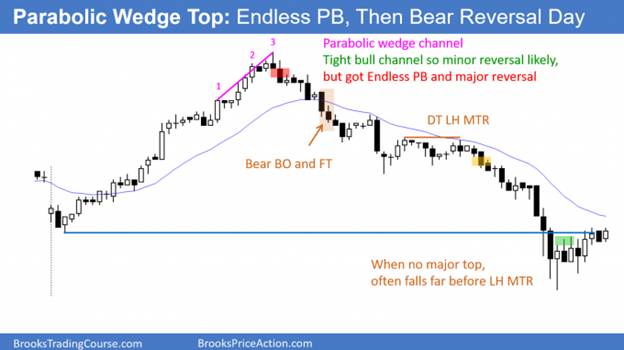
If there are 3 surges in a tight bull channel, the channel is a parabolic wedge. This is a buy climax and it can lead to a trading range, or even a bear trend reversal, like here.
Channels
The market is always in channels. Sometimes traders have to look at a higher time frame chart to see them. Most are not what textbooks and websites describe as channels.
However, traders know what channels really look like and they are very flexible when they choose points to draw lines. Once they see two points, they draw a line and watch to see if the market reverses if it gets back to the line. They are constantly erasing lines that the market is ignoring and are always drawing new ones.
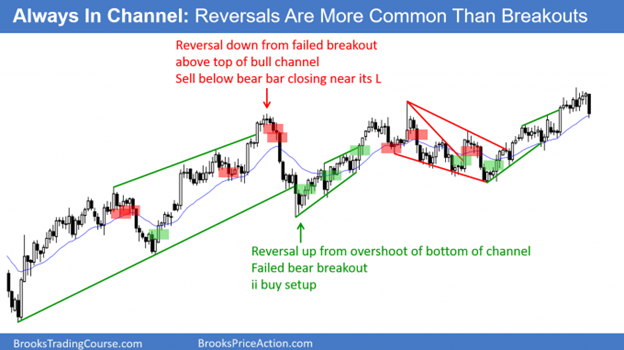
Every market is always in a channel. Sometimes it is clearer on a smaller or higher time frame chart. Traders look to enter on reversals since reversals are more common that breakouts.
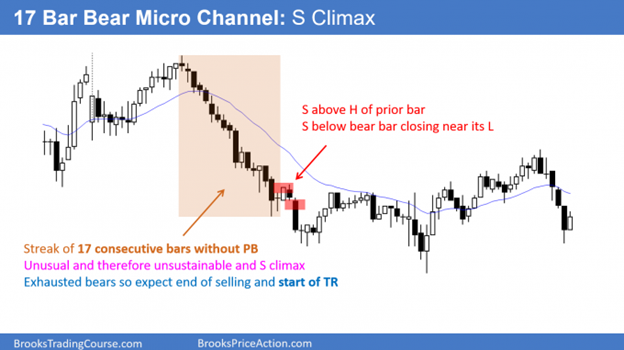
A micro channel is a series of bars without a pullback. It is a strong trend, but once it reaches about 10 bars, it is unsustainable. It therefore is also a climax. A climax typically evolves into a trading range.
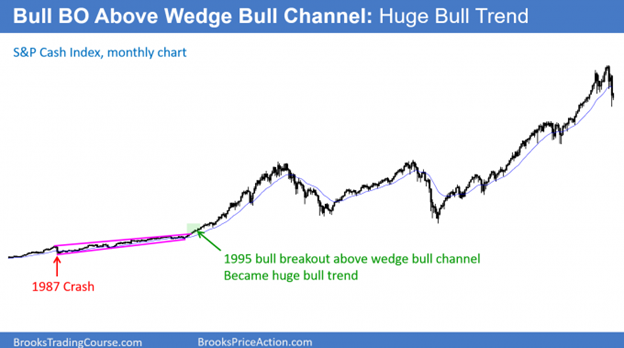
The S&P cash index was in a wedge bull channel from the 1987 crash to late 1994. It is difficult to see because the rally that followed a breakout above the bull channel has been huge. There is only a 25% chance of a successful breakout above a bull channel.
Measured Moves
The market often tries to do something twice. The result is that most tops are variations of double tops, most bottoms are variations of double bottoms, and trends often have at least a second leg with the size of the second leg related to that of the first leg.
Everyone is familiar with a Leg 1 = Leg 2 measured move. This i, where the market has a second leg that is almost identical to the length of the first.
Also, traders look for a measured move after a breakout from a trading range. They expect the move to be about the same size as the trading range is tall. The are many other types of measured moves that the computers use to either take profits or to enter reversal trades, and several are based on intraday gaps, or the height of breakouts.
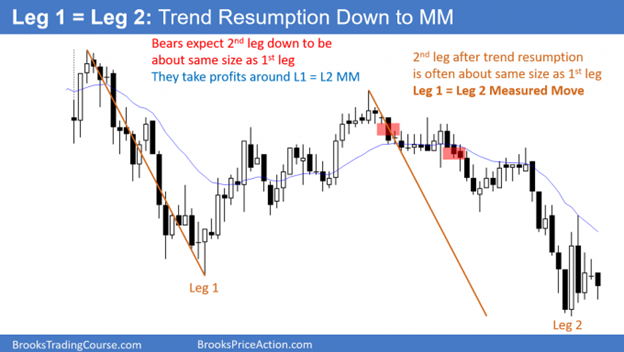
When there is a pullback from a trend, the trend typically resumes. The 2nd leg is frequently very close in size to the 1st leg. This is a Leg 1 = Leg 2 measured move. Traders look to sell a reversal own for a test of the measured-move target.
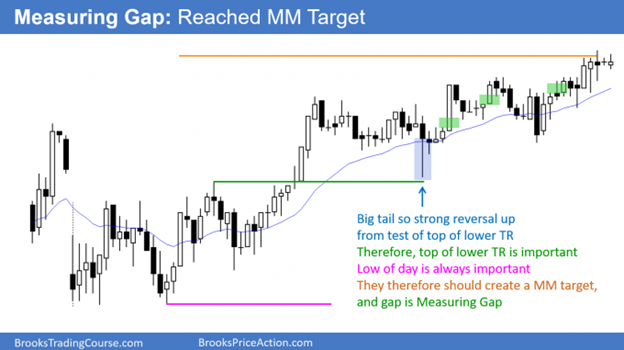
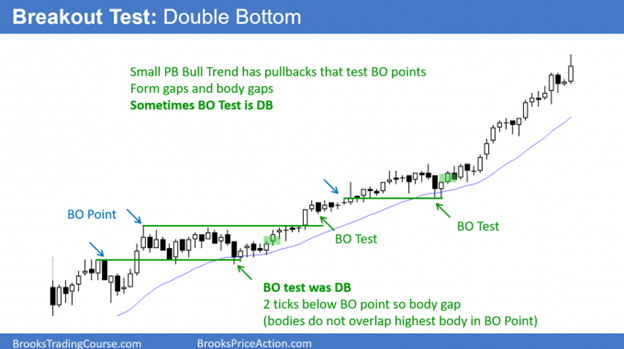
When there is a breakout, the trend often continues for a measured move based on the height of the earlier range. Traders buy the bull trend and any pullback. They especially like a pullback that tests the breakout point, but then reverses back up.
Trading Range Reversals
Even before a trading range is obvious, the market usually has signs of two-sided trading that alert traders to a possible trading range day. When that is the case, the market often races to the top with enough momentum to make traders erroneously believe that they can buy a small pullback and reasonably expect a second leg up. Similarly, they see a big bear trend bar at the bottom and then begin to sell bounces because they do not understand what is actually happening.
The market regularly gets vacuumed to the top, where bulls take profits instead of buying more, and the bears appear out of nowhere. Both the bulls and bears expect the test of resistance to lead to a failed breakout.
The opposite is true at the bottom. When the market gets near support, bear scalpers sell even more, expecting the market to fall just a little more. Bulls stop buying because they are confident that the market will reach the support and probably poke through it. Why buy now when they can buy lower in a few minutes?
The result is that the market creates strong bear bars at the bottom as it is vacuumed down to support. Instead of follow-through selling, buyers come. The bears buy to take profits and the bulls buy to initiate longs.
The legs up and down in a trading range are often strong. When they are, traders have a higher probability of making money if they wait for a 2nd signal.
When traders start out, they often do not realize that the market is forming a trading range until the day is over. The bars often give early signs, as they did here. There were many bars with prominent tails, lots of pullbacks, yesterday ended in a tight trading range (markets have inertia and tend to continue what they have been doing), and few areas of 2 or 3 consecutive big trend bars. This means that the bulls and bears were disappointed by the follow-through.
Beginners feel confused and disappointed by the repeated reversals, not realizing that these feelings are the hallmarks of trading ranges. When experienced traders detect those feelings, they look at them as opportunities. They bet that every breakout will reverse, and they look to buy low, sell high, and scalp.
Even when the market trended down at midday, they expected the breakout to the new low of the day to fail. This is because that’s what usually happens on trading range days. They bought the reversal up, betting that the rally would get back above the breakout point (the low of the first hour) and back into the trading range.
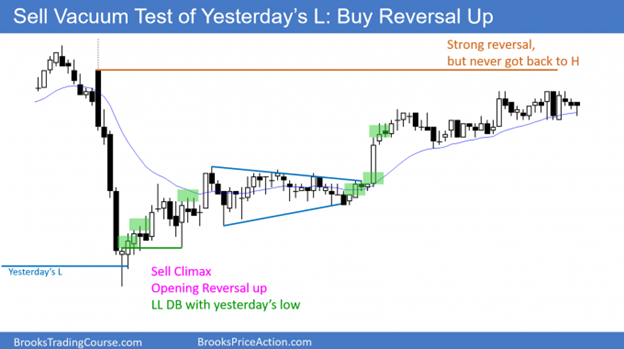
Opening Reversals
The components of an opening reversal pattern are:
- Usually fast move to a magnet (support or resistance)
- Reversal in 1st 60-90 minutes that leads to a swing for the next few hours or the entire day
Most strong bull trend bars on the daily chart have at least a small tail on the bottom, which is usually caused by an opening reversal (a selloff on the open that reverses up, and it is therefore a reversal pattern). Similarly, most bear trend bars on the daily chart usually have a tail on top caused by an opening reversal down.
There was a huge selloff on the open. It was a sell vacuum test of yesterday’s low, which is always a good candidate for support. The market rallied for the rest of the day.
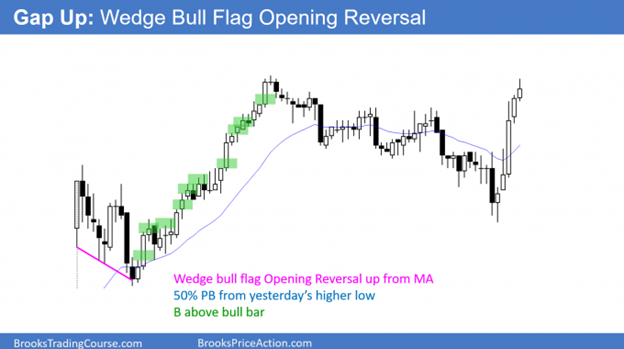
After a gap up, the market pulled back to the 20-bar EMA. The reversal up was the 3rd rally attempt and therefore this opening reversal was a wedge bull flag test of the EMA.
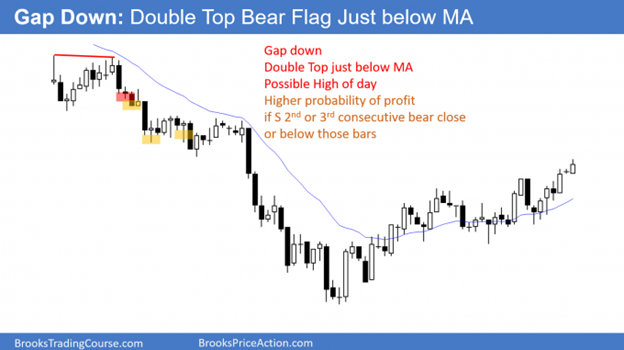
Whenever there is a gap down, traders will watch for a double-top bear flag around the EMA. They will sell the reversal down, hoping for an early high of the day and a bear trend.
Magnets (Support and Resistance)
The final pattern in my 10 best price action trading patterns is more of a concept than a setup. The market is always testing as it tries to establish a price range. It usually cannot tell if it has gone far enough up or down until it goes too far.
Support is any price below the market where buyers might come in, as either bulls buy to create new longs or bears buy to take profits. Resistance is any price above the market where bulls might take profits on longs and bears might short.
Common magnets include the tops and bottoms of trading ranges, prior highs and lows, trend lines, channels, measured move projections, and moving averages. Computers control the market, and all support and resistance is based on things that computer programs can calculate. The result is that the market often accelerates near the target once a substantial number of algorithms believe that the target will be reached.
When a market breaks above a prior high, it often pulls back to test that breakout point. Bulls will buy a reversal up.
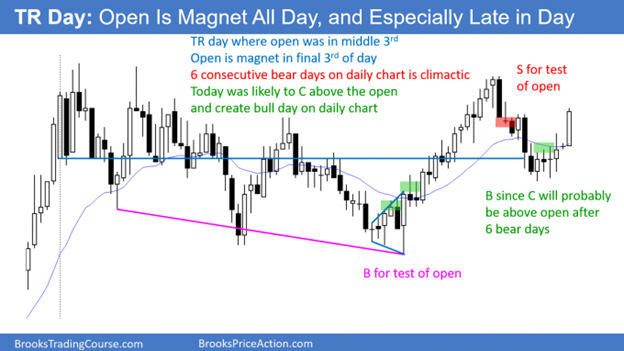
A trading range day often oscillates around the open all day. If the market is near the high or low of the day in the final two hours, look for a reversal toward the open. Most trading range days end the day around the open.
Beginner gets upset by strong rally suddenly becoming endless bear trend.
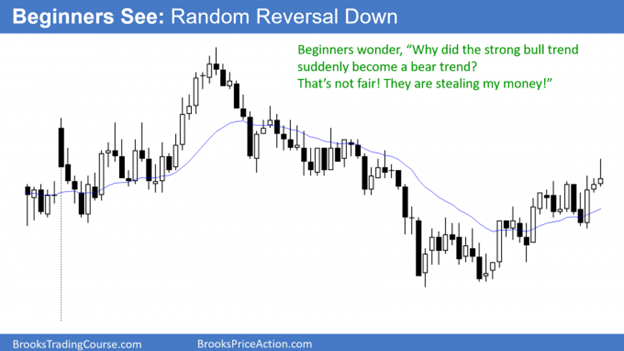
Experienced trader knows where resistance is and looks for a reversal down. Any strong rally to resistance can simply be a buy vacuum test of the resistance.
Learn more about Al Brooks at Brooks Trading Course.


