
After enduring a near-10% decline in the S&P 500 Index (^SPX) over a two-month period, the market recovered all that was lost in only 16 calendar days. Investors now face opposing possibilities presented by historical precedent as to what may happen next, suggests Sam Stovall, chief investment strategist at CFRA Research.
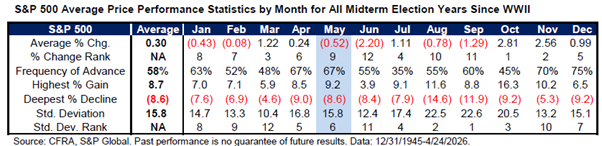
The market typically climbed more than 8% in the following three months after recovering all that was lost in pullbacks (declines of 5.5% to 9.9%) since WWII. Yet history also reminds us – but does not guarantee – that while the S&P 500 typically rose in price in April of midterm election years, it then declined in May and June (as well as August and September). That’s the challenging “Sell in May” period, in which the S&P 500 posted an average decline and fell more frequently than it rose.
(Editor’s Note: Sam is speaking at our July 2026 MoneyShow Virtual Expo. Click HERE to register.)
The US/Iran conflict remains unresolved, but is expected by most to be resolved in the near term. Combined with the strong start to the Q1 2026 earnings reporting period, that should add to the already impressive count of new highs for the S&P 500 (nine) in the near term. But we will monitor the impact of a prolonged increase in oil prices and whether current EPS growth expectations need to be trimmed as a result of the oil-related slowing of global economic growth.
Meanwhile, the maxim of “Sell in May” has been around for decades. Since 1945, the S&P 500 gained nearly 7% in the six-month period from Oct. 31 through April 30, rising in price 75% of the time. Conversely, the market advanced only an average of 2% from April 30 through Oct. 31, and gained in price only 66% of the time.
During midterm election years, the results from May through October were even worse. The “500” fell an average of 1.2% and rose in price just 50% of the time. This underwhelming performance has also been consistent since 1990, which is as far back as S&P Global has sector-level data.
Since then, the S&P 500 posted an average 1.6% decline and fell 56% of the time. That was accompanied by average losses for all sizes and styles, as well as seven of 11 sectors and more than 60% of the 73 subindustries in existence since 1999.


