

One more month to go for 2011, and as we hit the beginning of December, it is time step back and reflect upon the broader picture. For this, I look at the monthly charts.
Many stocks are either moving sideways or are in strong trends, but with their Relative Strength Index (RSI) readings getting toward extreme levels on this time frame. Two names with clean monthly charts to consider adding to your long-term account, however, are Hain Celestial (HAIN) and Home Depot (HD).
Let’s take a look first at HAIN.
Hain Celestial (HAIN) had a long rally from the hammer reversal candle printed in February 2010 to the top in May 2011 before the pullback, running over $20. Since that pullback, it has now broken above the resistance of the May 2011 top and is continuing higher.

Click to Enlarge
It is supported to the upside by an RSI that is bullish and rising, but far from any extreme level, and a Moving Average Convergence Divergence (MACD) indicator that has reversed the move lower and is now increasing again.
Further reinforcing the move up is the increasing volume. Closing November at $37.34, the stock has a measured move (MM) higher to $50, or another 34% above the current price.
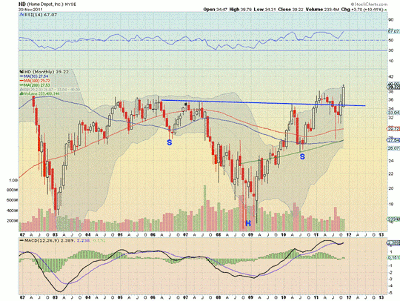
Now, on to Home Depot (HD).
Click to Enlarge
Home Depot (HD) has also been stairstepping higher. Recently breaking the early-2011 highs, it is now running higher still. It has support of the RSI firmly bullish and rising, and the MACD has now crossed positive and is starting to grow.
The measured move takes this name to $42.50, but it has also moved above the neckline of an inverted head-and-shoulders pattern with a target of $55, which is a full 40% above the current price.
These long-term charts can help provide clarity, but they also require patience. You cannot buy either of these stocks and expect the moves to be fulfilled in a straight line or over a one- to two-month period. Give the monthly charts a wider berth and look at them less frequently to adjust or stop out a trade.
By Greg Harmon of Dragonfly Capital


