Our Chart of the Week shows that gold is still in the limelight. It's been rising all year while the dollar index and the 10 year yield fell furtherexplains Omar Ayales, chief trading strategist of Gold ChartsRUs.
Note how clearly gold moves opposite to both the dollar and the yield. This chart is key ST, and we suggest keeping an eye on the 15 week MAs at $1235 for gold, 100.90 for the dollar index and 2.42% on the 10 year yield.
It's been gold and now bonds, the safe havens, that are the lone rangers in this latest run-up.
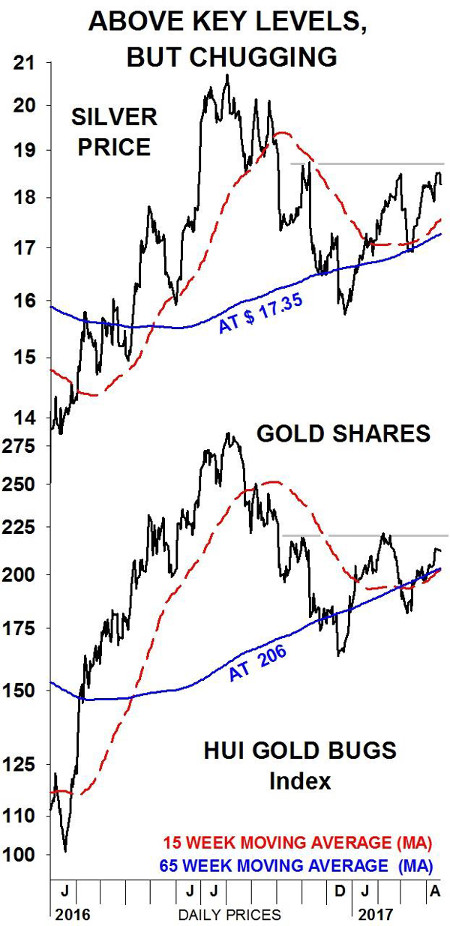
Silver and gold shares are chugging and failing to rise above their February highs, like gold did, see the Chart below. Both continue to hold above their key MAs, which is good, but they may be reflecting maturity for gold's A rise.
This gold rise has been a great one, but the end may be near. We recommend selling half of your position to protect profits in gold, Agnico Eagle Mines (AEM) and Silver Wheaton (SLW).
Market Vectors Junior Gold Miners ETF (GDXJ) — and therefore, Direxion Shares ETF Trust (JNUG) — seems to have become too large for its index.
Although it's likely that GDXJ will go back to having the relationship it's had with gold, we prefer to lower exposure in the event of a stronger decline. We recommend selling half GDXJ, ideally above $36. As to JNUG, we recommend selling.
Meanwhile, the industrial metals tanked, which has continued to affect silver. An index of base metals fell to its November lows while skepticism grew for the outlook for commodity demand. That is, questioning China's demand growth as well as the U.S. infrastructure spending plans.
We recommend keeping silver for now and as long as it holds above key uptrend and support levels near $17.
Resources also continued to decline. Copper and crude continue to slide as global demand remains tepid and price action reacts to supply disruption.
Our strategy for this week is to rebalance your portfolio. We recommend protecting some profits in gold, SLW and AEM and reducing exposure to GDXJ. We're looking to sell JNUG too. Keep a close eye on gold.
A rise that holds above $1300 would push gold into another leg up with upside potential to a key multi-year resistance near $1380. Also keep an eye on the 10YY and the U.S. dollar index. If these continue to fall, it could give gold the extra boost needed to surpass its short-term resistance near 1300.


