

Investors are partying like its 2010 as earnings growth came back with a vengeance in Q1, asserts Don Kaufman, Co-founder of TheoTrade.
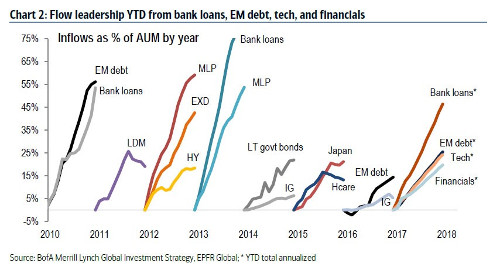
The fund flows give us a picture of the direction of the market. The chart below shows the leadership of fund flows in each year. Sometimes leaders signal the coming burst of a bubble and other times it’s the sign of an emerging trend. As you can see, MLPs were leaders in 2012 and 2013. That signaled the end of the investment vehicle’s prominence as oil prices falling hurt them.
Bank loans accumulating investments signaled the start of a new business cycle in 2010. It’s interesting how emerging market debt and bank loans are the leaders this year just like in 2010. It signals that investors believe we’re at the start of another business cycle.
It’s shocking to me because the cycle is 8 years old. It shows how investors believe that the recovery in earnings means the cycle is starting over. Analysts’ projections lack context, in my opinion. They think margins are going to accelerate when they never fell to historical norms during the mini earnings recession from mid-2014 to Q1 2016.
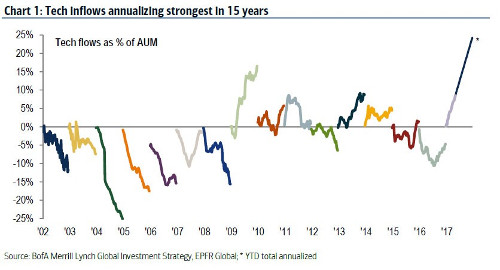
The other interesting part of the latest asset flows is how technology is gaining investor interest. If you remember from a previous article, the long Nasdaq trade was considered to be the most overcrowded trade by fund managers. The chart below supports that thesis as the annualized fund flows show that investors are the most bullish on tech since the tech bubble in the early 2000s. This likely won’t continue at the same rate.
The Nasdaq Internet Index is annualizing a 75% gain. I doubt that trend will hold. I’m not saying that the Nasdaq is about to crash because it relies on the mega cap firms that had great reports a few weeks ago.
Speaking of earnings reports, Wal-Mart (WMT) had a solid quarter as comparable sales grew 1.4% which was above estimates for 1.3%. Considering the weak results from the other retail players, beating expectations slightly is a great result. Online sales were up 63%. That’s not a comparable number to last year because it includes the acquisition of Jet.com. However, the firm said most of the growth was organic. Earnings per share was up 2% and revenue was up 1.4%. This report caused the stock to rally about 5% in the past two days. It also signals moderate strength from the consumer.
Results from Target (TGT) reflect a different trend in consumer behavior as it had a 1.3% drop in same store sales. That was actually considered to be a good report because estimates were for a 3.6% drop, but looking at it from a macroeconomic perspective, it signals the consumer is weak. Target stock was up less than 2% after the report showing that even though the same store sales results beat estimates, investors don’t like negative results.
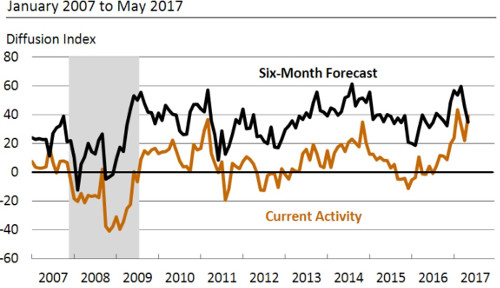
Shifting gears to the macroeconomy, the Philly Fed Manufacturing Index was a reverse of the Empire State Manufacturing Index. The Empire State Index showed the current manufacturing grinding to a halt, but the outlook remaining positive. As you can see in the chart below, the Philly Fed Index saw current activity flourish while the 6-month forecast tumbled lower. This is the first time since 2007 where the outlook was lower than current activity. It’s important to recognize that the Philly Fed and Empire state surveys are from May, while the industrial production report was from April. This means these surveys are clues as to how the industrial production report will shape up in May. If it’s a good report again, it’ll be bullish for the Q2 GDP report.
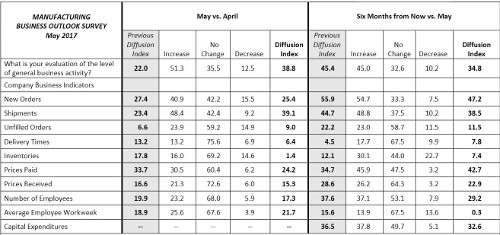
The chart below breaks down the Philly Fed report completely. As you can see, the diffusion index improved from 22.0 to 38.8 and the 6-month forecast fell from 34.8 to 45.4. The new orders index showed a decline from 27.4 to 25.4. I’m also focused on the prices paid and prices received indexes because they give us an insight into how inflation is looking. Remember, inflation has been decelerating, but the Fed is raising rates in June because it thinks that trend is transitory. The Philly Fed report supports the idea that the lack of inflation isn’t transitory because the prices paid index fell from 33.7 to 24.2 and the prices received index fell from 16.6 to 15.3. On the bright side, inflation is expected to pick up slightly as the prices paid index forecast went up from 34.7 to 42.7. However, the prices received forecast index fell from 28.6 to 22.9.
The main takeaway I have from this report is that a manufacturing recession is not as close as the Empire state index makes it seem and that inflation is still weak. This report won’t change the Fed’s decision on rates, but it should give it pause. If other data is consistent with this, the Fed may decide to only raise rates one more time this year.
The final point I will make in this article is that the dollar’s collapse will help boost earnings in the next few quarters for multinationals. The dollar index has fallen from 103.82 in December to 97.14 as of the close on Friday. The index is down 5% for the year. If you remember, the dollar bubble crashing was one of my predictions for the year. It’s interesting how estimates for earnings in the rest of the year are coming down even though the dollar is falling. This makes the estimates more likely to be hit now. Stocks are already rallying on earnings, so this adds fuel to the fire. Keep in mind, that I’m still bearish in the long term because of valuations.
Conclusion
Investors are partying like its 2010 as earnings growth came back with a vengeance in Q1. This may continue because the dollar has been selling off in the past few weeks. This might be happening because of the political tumult. President Trump is in favor of a weak dollar, but it’s doubtful that this is how he wanted that prospect executed. The Philly Fed index shows the trend of disinflation is continuing which pressures the Fed’s forecast that it will be temporary.


