

Just because it won't cause a financial crisis of the same proportions doesn't mean it's not a big deal. Auto loans fraud is high, and leveraged loans are about to have the highest growth since at least 2007. That money is going to M&A, asserts Don Kaufman.
The auto loan bubble has often been discussed as the leading credit bubble in the economy along with the student loan bubble. Comparing it to the housing bubble is like comparing a house to a car; it doesn’t make sense.
There’s no need to compare it to anything. The facts are that auto loans have been given to unqualified buyers which will cause an increase in defaults and a decline in the number of cars sold.
The decline in cars sold will be a negative impact on the economy. Also, the used car market will plummet because of a large number of leases which will come off line in the next few years. The decline in the value of used cars will cause lease payments to increase to make up for that. Consumers will be hurt, the banks will be hurt, and GDP growth will be dinged by the over $1.2 trillion auto loan market.
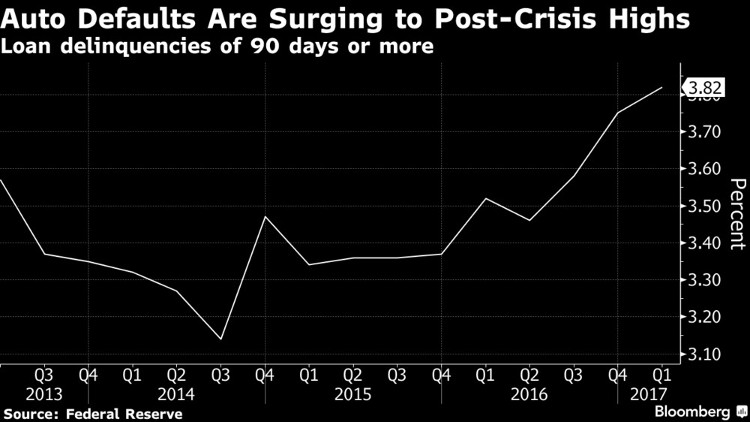
The chart below shows the latest changes in auto loan delinquencies. As you can see, the delinquency rate has been increasing since Q4 2014. Q3 2014 was the top in corporate profits, but unlike profits, delinquencies haven’t reversed course in the past couple quarters. Despite decent wage growth and a high stock market, the defaults have accelerated. The total subprime auto bonds were $2.5 billion in 2009 and in 2016 it was $26 billion. It’s estimated that 1 in 5 loans have fraud involved. The appetite for high yielding debt is the highest in history as interest rates are the lowest ever. Therefore, I wouldn’t be surprised to see that the lending standards are worse than many of the estimates.
The most important question is the chicken or the egg? Will the auto loan weakness cause a recession, or will economic weakness cause a blowup of the auto loan bubble?
The Q2 GDP report, which comes out July 28, will give us a hint of the answer. We’ll see if the auto market hurts GDP enough to bring down the number. The weakness is only in the beginning phases; if nothing is seen, it doesn’t mean we can rest assured that the economy won’t be pushed into recession by the auto loan market.
The debate between the bears and bulls is whether the corporate debt is too high. The corporate debt to GDP is near a record high, but the trend has been to have higher highs each cycle, so the bulls claim there’s more room to run.
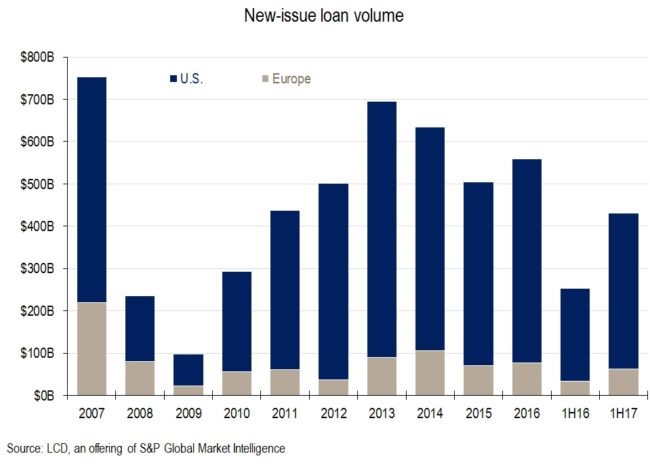
The chart below gives us some more context to tell which side is correct. U.S. leveraged loan issuance is up 68% to $368 billion in the first half of 2017 as it is on pace to take out the 2007 high. Although it’s tough to tell from the brown bars, European loan issuance is up 84% to $62.7 billion. Both regions’ cov-lite loans represent 70% of total loans. Q2 was a big quarter for M&A in the leveraged loan market as its share increased by 29% to 55% sequentially in Europe and by 10% to 50% in America (also sequentially).
These stats show us the same picture that the corporate spreads tell us; there is intense demand for loans by investors with risky loans being especially valued because of their high yields. This risk is problematic when the credit cycle unwinds; it’s especially worrisome because of the large share of cov-lite loans as lenders are in the dark. My forecast is that cov-lite loans won’t be popular in the long-term after they blow up. I don’t see a blow up in the next few months as no indicators are falling off a cliff. The jobless claims are still low as the latest reading saw a 15,000 decline to 233,000.
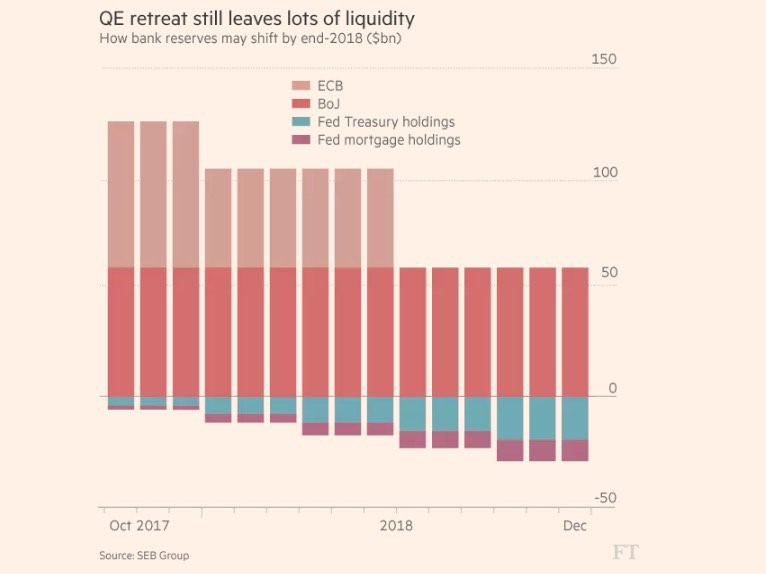
While the bears are on the run, the one aspect which they continue to be correct on is the fact that, even with the latest tapering, central banks’ balance sheets are still expanding. They challenge the bulls making the claim that without the asset buying, the economy would falter. The answer to this assertion should come in 2018. In a previous article, I showed an estimate where Credit Suisse thought the JCB would end its buying in 2020. The chart below is another estimate of where central bankers will take policy in the next 18 months. The time scale seems to be warped on the bottom. The number 2018 should be below the fourth tick which is longer than the others. Assuming the 2018 number is placed in the wrong spot, I’d say it’s surprising to see the estimate that the ECB will completely end its bond buying in mid-2018 while the JCB doesn’t alter policy at all.
I wouldn’t go as far as saying this is wrong because predicting the first globally coordinated unwind ever is difficult. The one conclusion that we can draw is that the Fed’s policy has the most consensus around it because the Fed has given specific numbers, laying out the plan very transparently.
The lack of transparency from the ECB and the size of its buying is why I have been focused on it the most. I think a change in policy which follows the path in the chart below would cause market volatility as the free market starts to be given more power over asset prices.
Conclusion
The reason I say comparing the auto loan bubble to the housing bubble is different is because the auto loan market doesn’t operate on the premise that car values will always rise like with housing in the 2000s. Secondly, the auto market is smaller.
Just because it won’t cause a financial crisis of the same proportions doesn’t mean it’s not a big deal. Not only are auto loans high, but also leveraged loans are about to have the highest growth since at least 2007. That money is going to M&A.
Finally, if the ECB decides to accelerate the tapering in July 2018 where it’s halted completely I expect stress in the markets. The ECB’s policy will be dependent on how the January 2018 tapering goes.


