

Trade ideas: Ten stocks to consider and why. Keep a close watch on your positions. Set tight stops. We can still achieve some nice gains, but it will pay to be more selective in our trade selection and quickly cut losses, says Kerry Given, PhD, founder of Parkwood Capital.
After the S&P 500 Index (SPX) hit an all-time high on November 8, the broad market indices traded down steadily until the bullish spike higher Thursday, Nvember 16. SPX gapped higher at the open and tacked on 21 points before the day’s trading was done. But Friday was a different story. I think the tax reform soap opera is taking its toll on the markets.
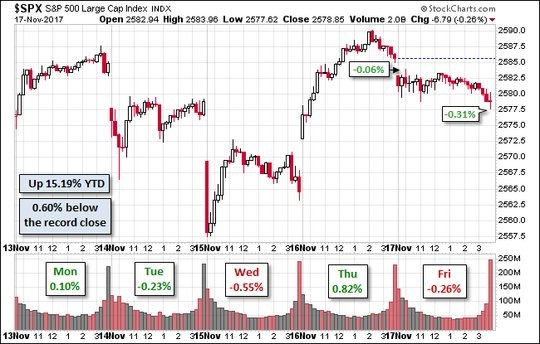
Standard and Poor’s 500 Index (SPX)
Chart courtesy of StockCharts.com
We have nearly completed the earning announcement cycle for the third quarter and it was one of the best earnings cycles in several years with 80% of companies beating analyst earnings estimates.
With solid corporate earnings growth, a strong bull market shouldn’t be a surprise. Perhaps this market isn’t as reliant on passage of a tax bill as many have speculated.
The recent market slide through this past Wednesday was said to be based on rumors of the tax reform push meeting significant hurdles. If that were true, why did the market pop back so strongly Thursday? If anything, it is becoming clear that the probability of a tax bill reaching the President’s desk is seriously eroding.
Consider the flat pattern of trading volume on the S&P companies. This is the sign of a slowing market. SPX is trending sideways in the range of 2565 to 2600. Trading volume declined during the strong spike higher on Thursday.
SPX traversed the full width of the Bollinger bands from November 9 through this past Wednesday, with the intraday low on Wednesday nearly touching the lower edge of the bands.
Thursday’s spike brought SPX back above the middle of the bands, but Friday’s weak price action left the index right on the 20-day moving average (dma).
Standard and Poor’s 500 Index (SPX) with Bollinger Bands
Chart courtesy of StockCharts.com
The Russell 2000 Index (RUT) has become the anti-establishment index. October 3 started a steady slide in RUT, giving up 48 points or 3.2% by the
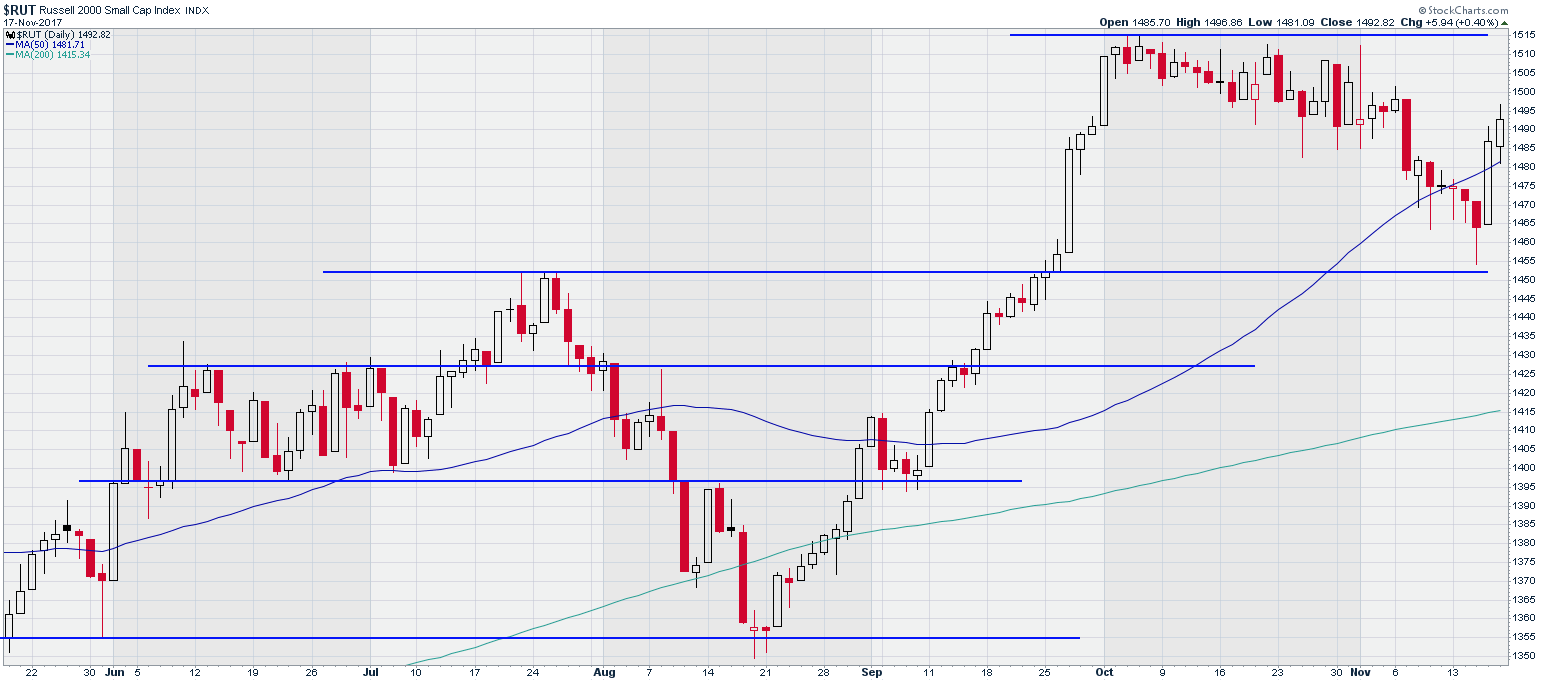
Russell 2000 Index (RUT)
Chart courtesy of StockCharts.com
close on this past Wednesday – a 3% decline at the same time that the broad market indices were setting new highs.
RUT played ball with its big brothers and spiked higher on Thursday. But Friday’s trading continued higher on Russell, contrasted with weakness in the S&P 500 and the NASDAQ Composite.
The NASDAQ Composite hit a new all-time high on Thursday, but it couldn’t manage to hold that level Friday, closing down 11 points at 6783. We noted SPX’s flat trading volume earlier, but NASDAQ takes it a step further, running right along the 50 dma for the past six trading sessions without a blip one way or the other. This is one more sign of a loss of enthusiasm – a slowing market.
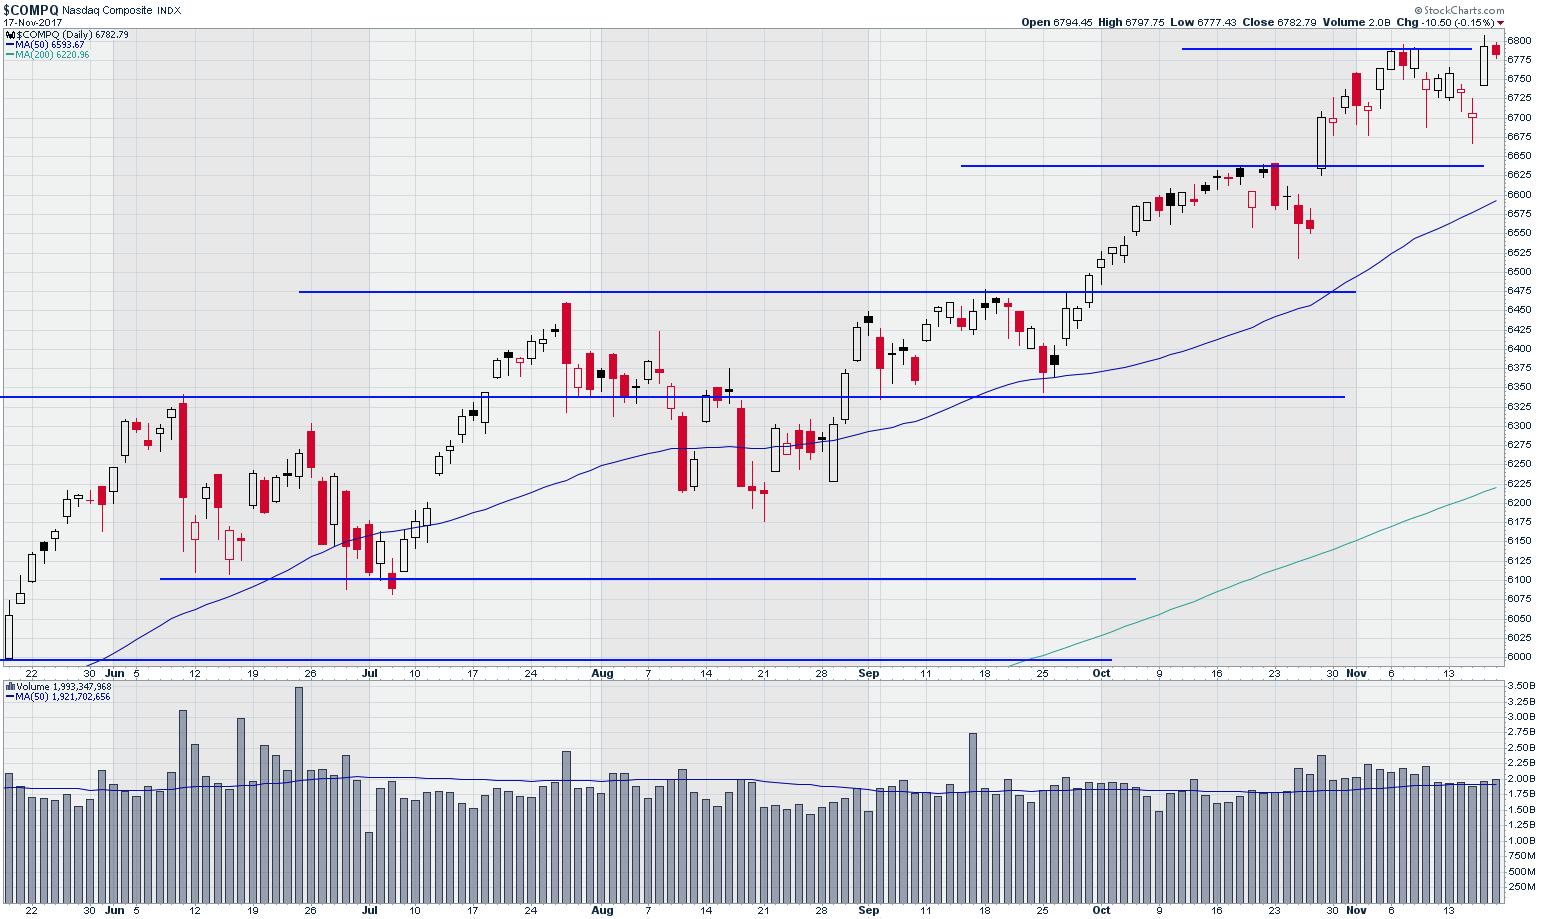
NASDAQ Composite Index
Chart courtesy of StockCharts.com
The volatility index for the S&P 500 Volatility Index (VIX) rose during the recent market decline, from a low of 10.5% on November 9 to an intraday high of 14.5% on November 15 this week. VIX closed Friday at 11.4%, in much calmer territory.
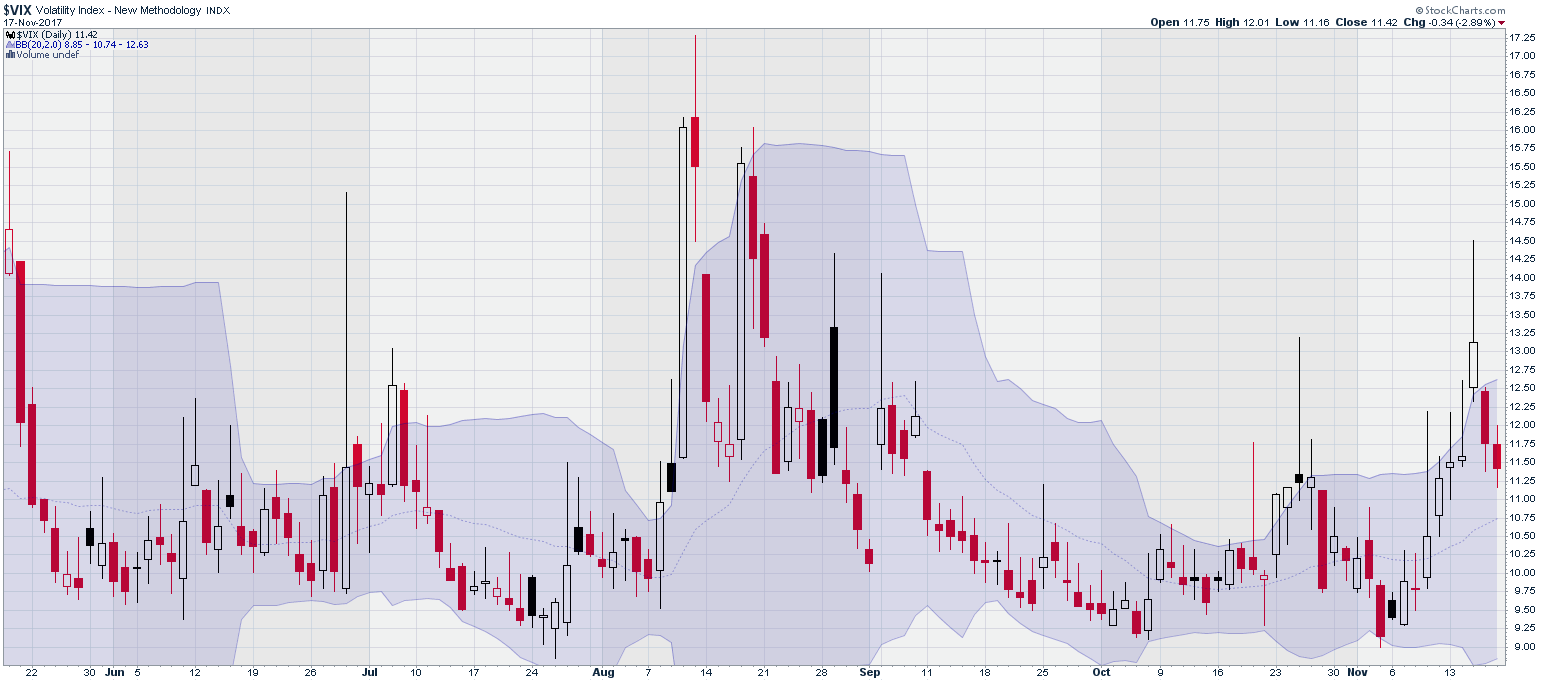
CBOE SPX Volatility Index (VIX)
Chart courtesy of StockCharts.com
Passage of significant corporate tax reform would boost this market, but the prospect is fading quickly.
That brings us back to the question of market valuation – is this market becoming over-valued and overdue for a correction?
With completion of this earning cycle, the forward looking 12-month P/E ratio for the S&P 500 companies is now 18.0. While that may not sound too frothy, the five-year average P/E is 15.7 and the ten-year average is even lower at 14.1.
So, the warning bells are sounding. Should we go to cash?
The hard economic data remain strong and are generally trending higher. In that environment, a significant correction, or a crash, seems unlikely. But we may be in for some choppy sideways trading, much as we have seen over the past three or four weeks.
Continue to trade from a bullish posture, but we need to become more particular about our stock picking.
I performed a useful exercise that I would recommend to you. I noted the dip in SPX from November 9 through November 15, and looked for stock price charts that traded higher during that period, or at least traded flat.
I wanted stocks who didn’t appear to realize the overall market was sliding a bit. That generated the following list:
Align Technology (ALGN)
Applied Materials (AMAT)
Amazon (AMZN)
Arista Networks (ANET)
Cognex (CGNX)
D. R. Horton (DHI)
Intuitive Surgical (ISRG)
Lam Research (LRCX)
Red Hat Software (RHT)
and WMWare (VMW).
Keep a close watch on your positions and set tight stops. This is a nervous market. I believe we can still achieve some nice gains in the market, but it will pay to be more selective in our trade selection and to quickly cut losses.


