

Should you be worried about Friday’s sharp decline, asks Kerry Given?
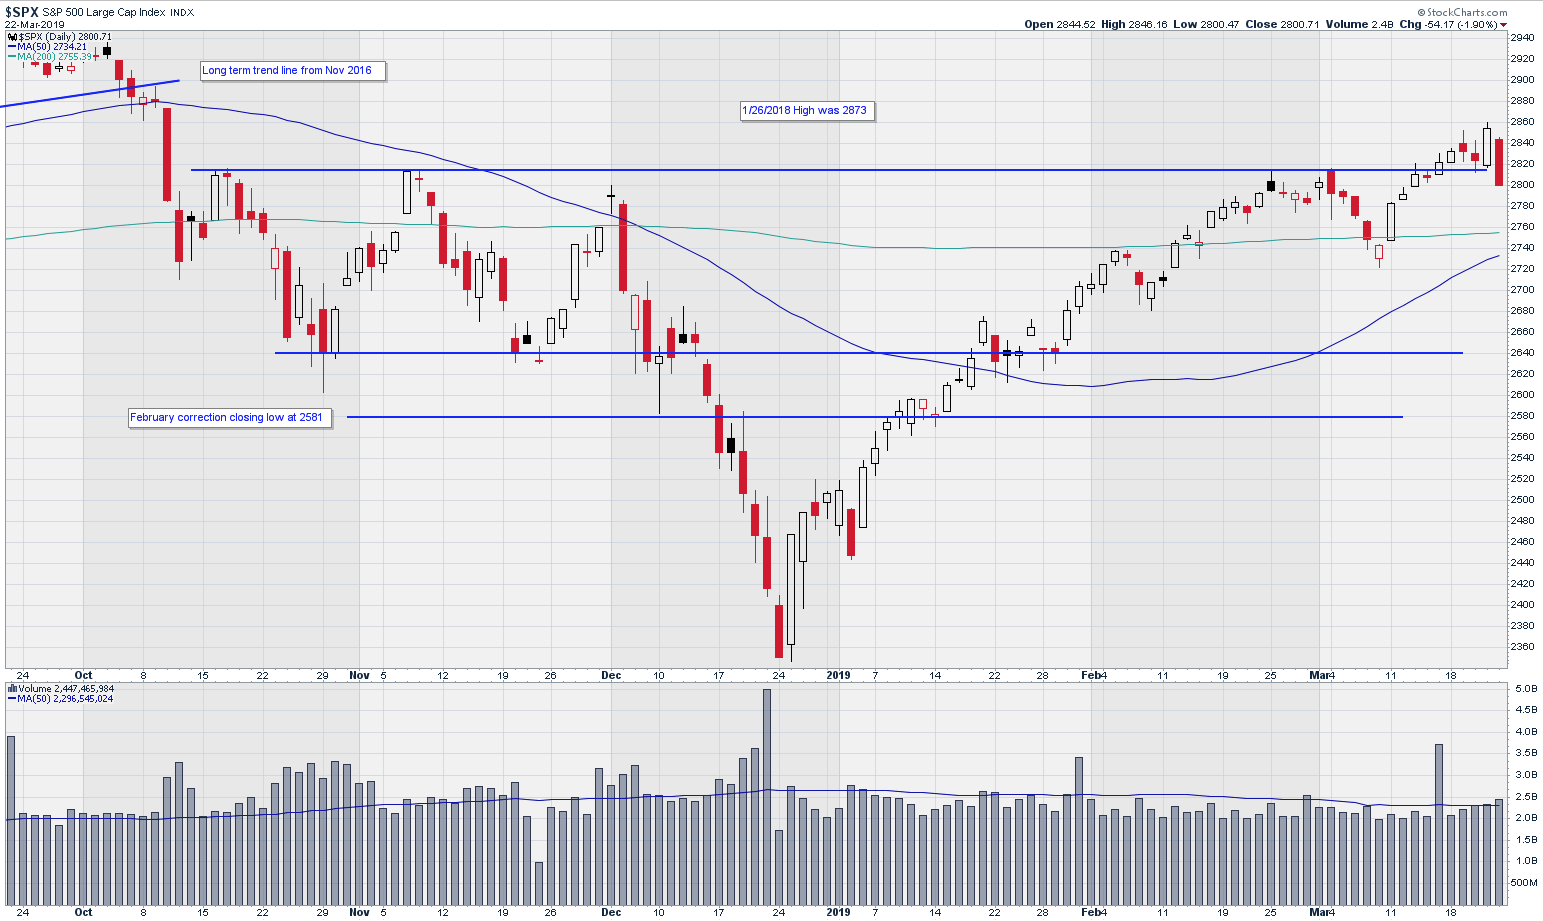
This question keeps popping up this year after every market hiccup. Should I be worried about Friday’s sharp decline? The S&P 500 Index (SPX) broke down through the 200-day moving average on March 8, but immediately turned back higher and closed this past Thursday at 2855, a market high since the September and October highs before the corrections last fall.
In total, SPX had gained 504 points or 21% since the low point on Dec. 24. But then the market tumbled Friday and, even more ominously, closed at its low for the day at 2801, down 54 points or 1.9%.
Standard and Poor’s 500 Index (SPX)
Before we panic, let’s check the trading volume. Volume rose slightly this week, but it barely exceeded the 50-day moving average, even on Friday with this perceived run for the exits. We are seeing some minor profit taking, not wholesale unloading of positions by the large institutional trading firms.
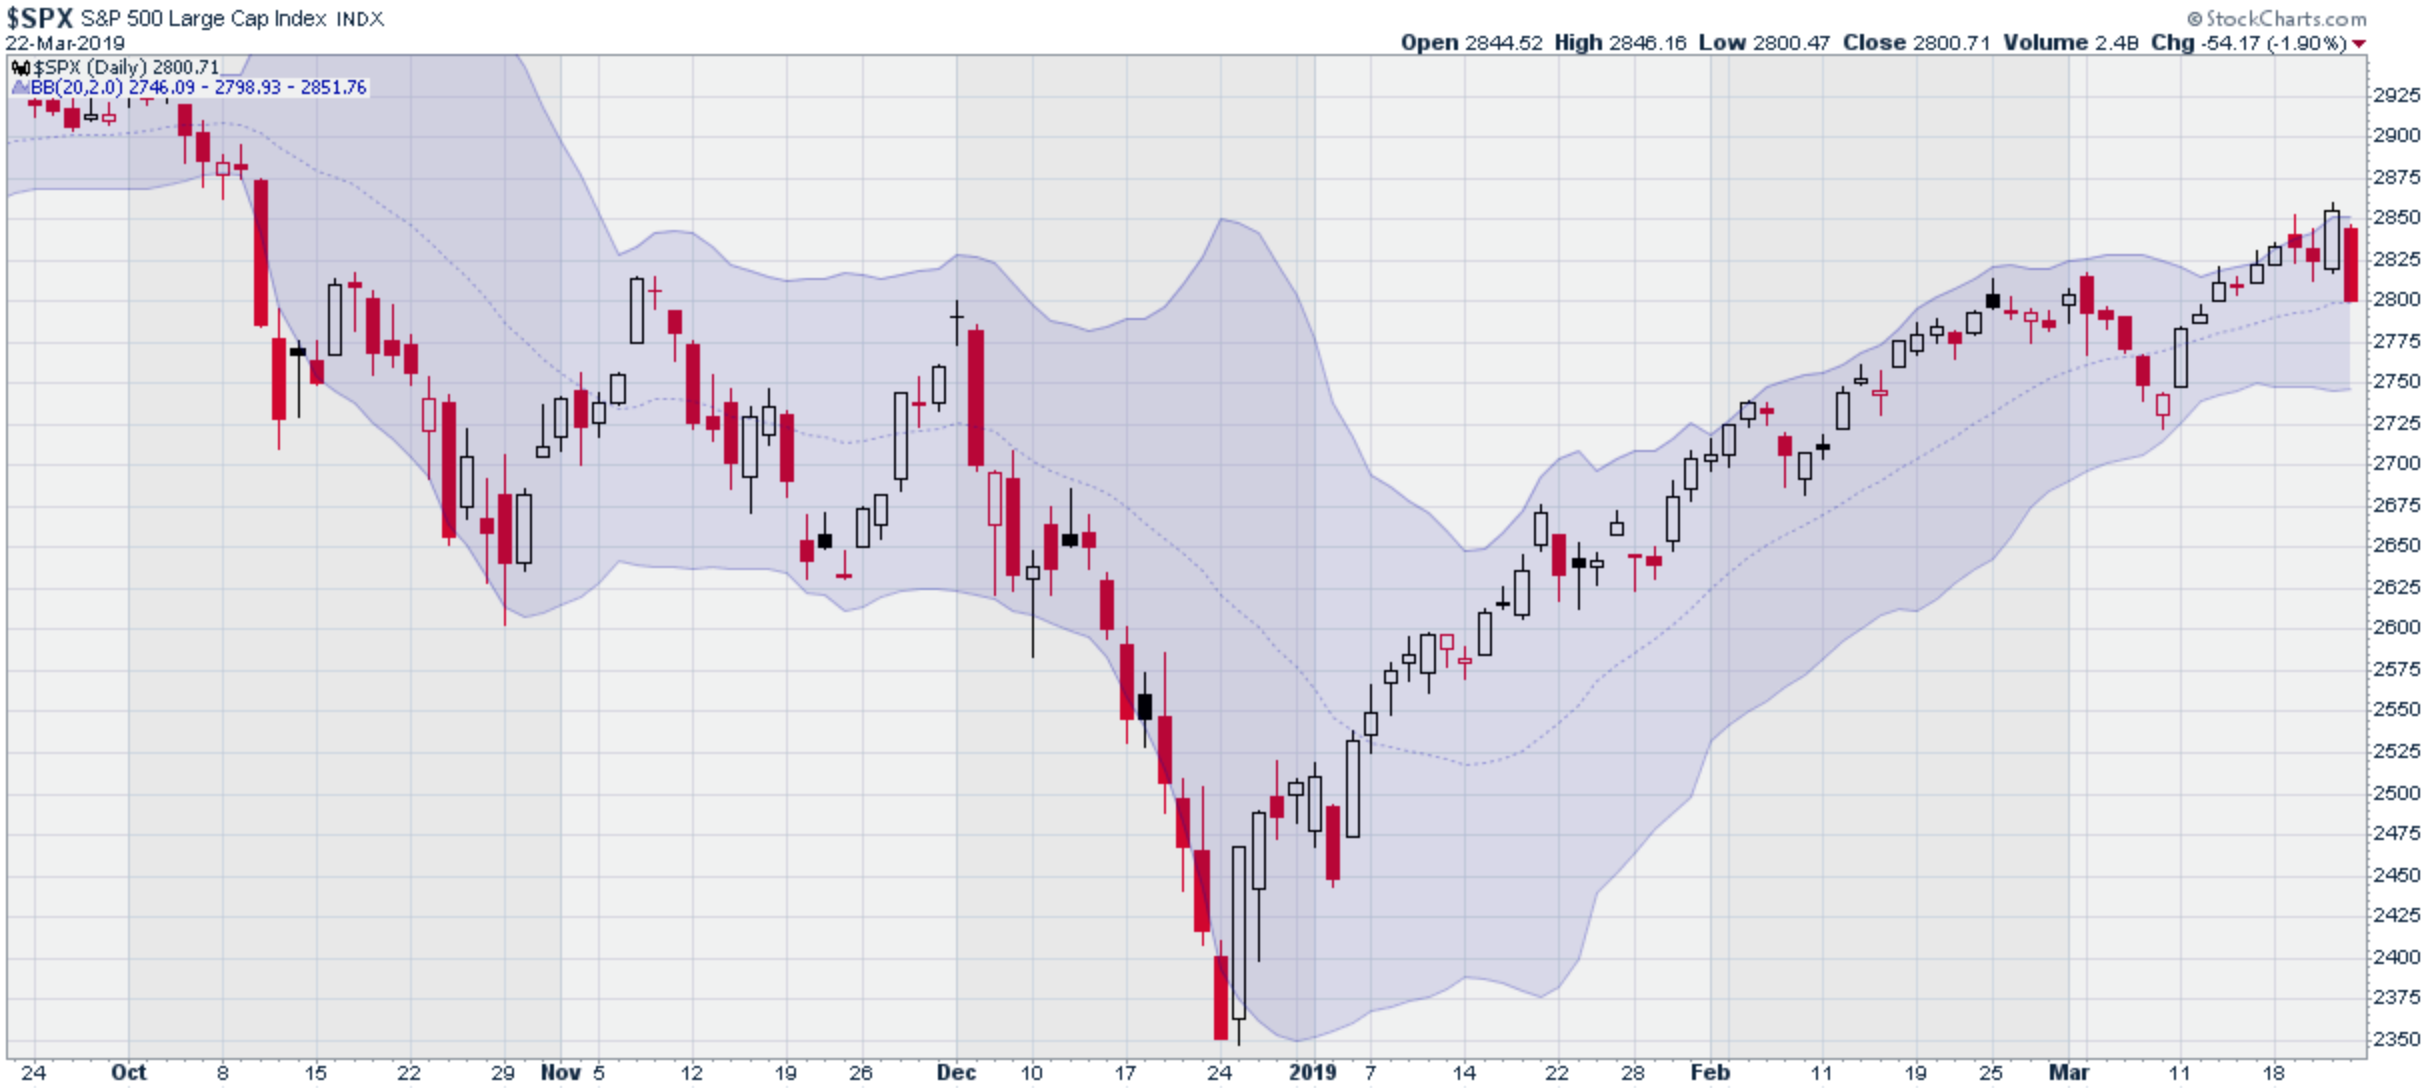
Turning to the SPX price chart with its Bollinger bands, SPX has been running along the upper edge of the bands for about seven trading sessions. Thursday’s price action pushed the price outside the upper edge of the Bollinger bands. From purely a statistical standpoint, Friday’s pullback wasn’t too surprising.
SPX with Bollinger Bands
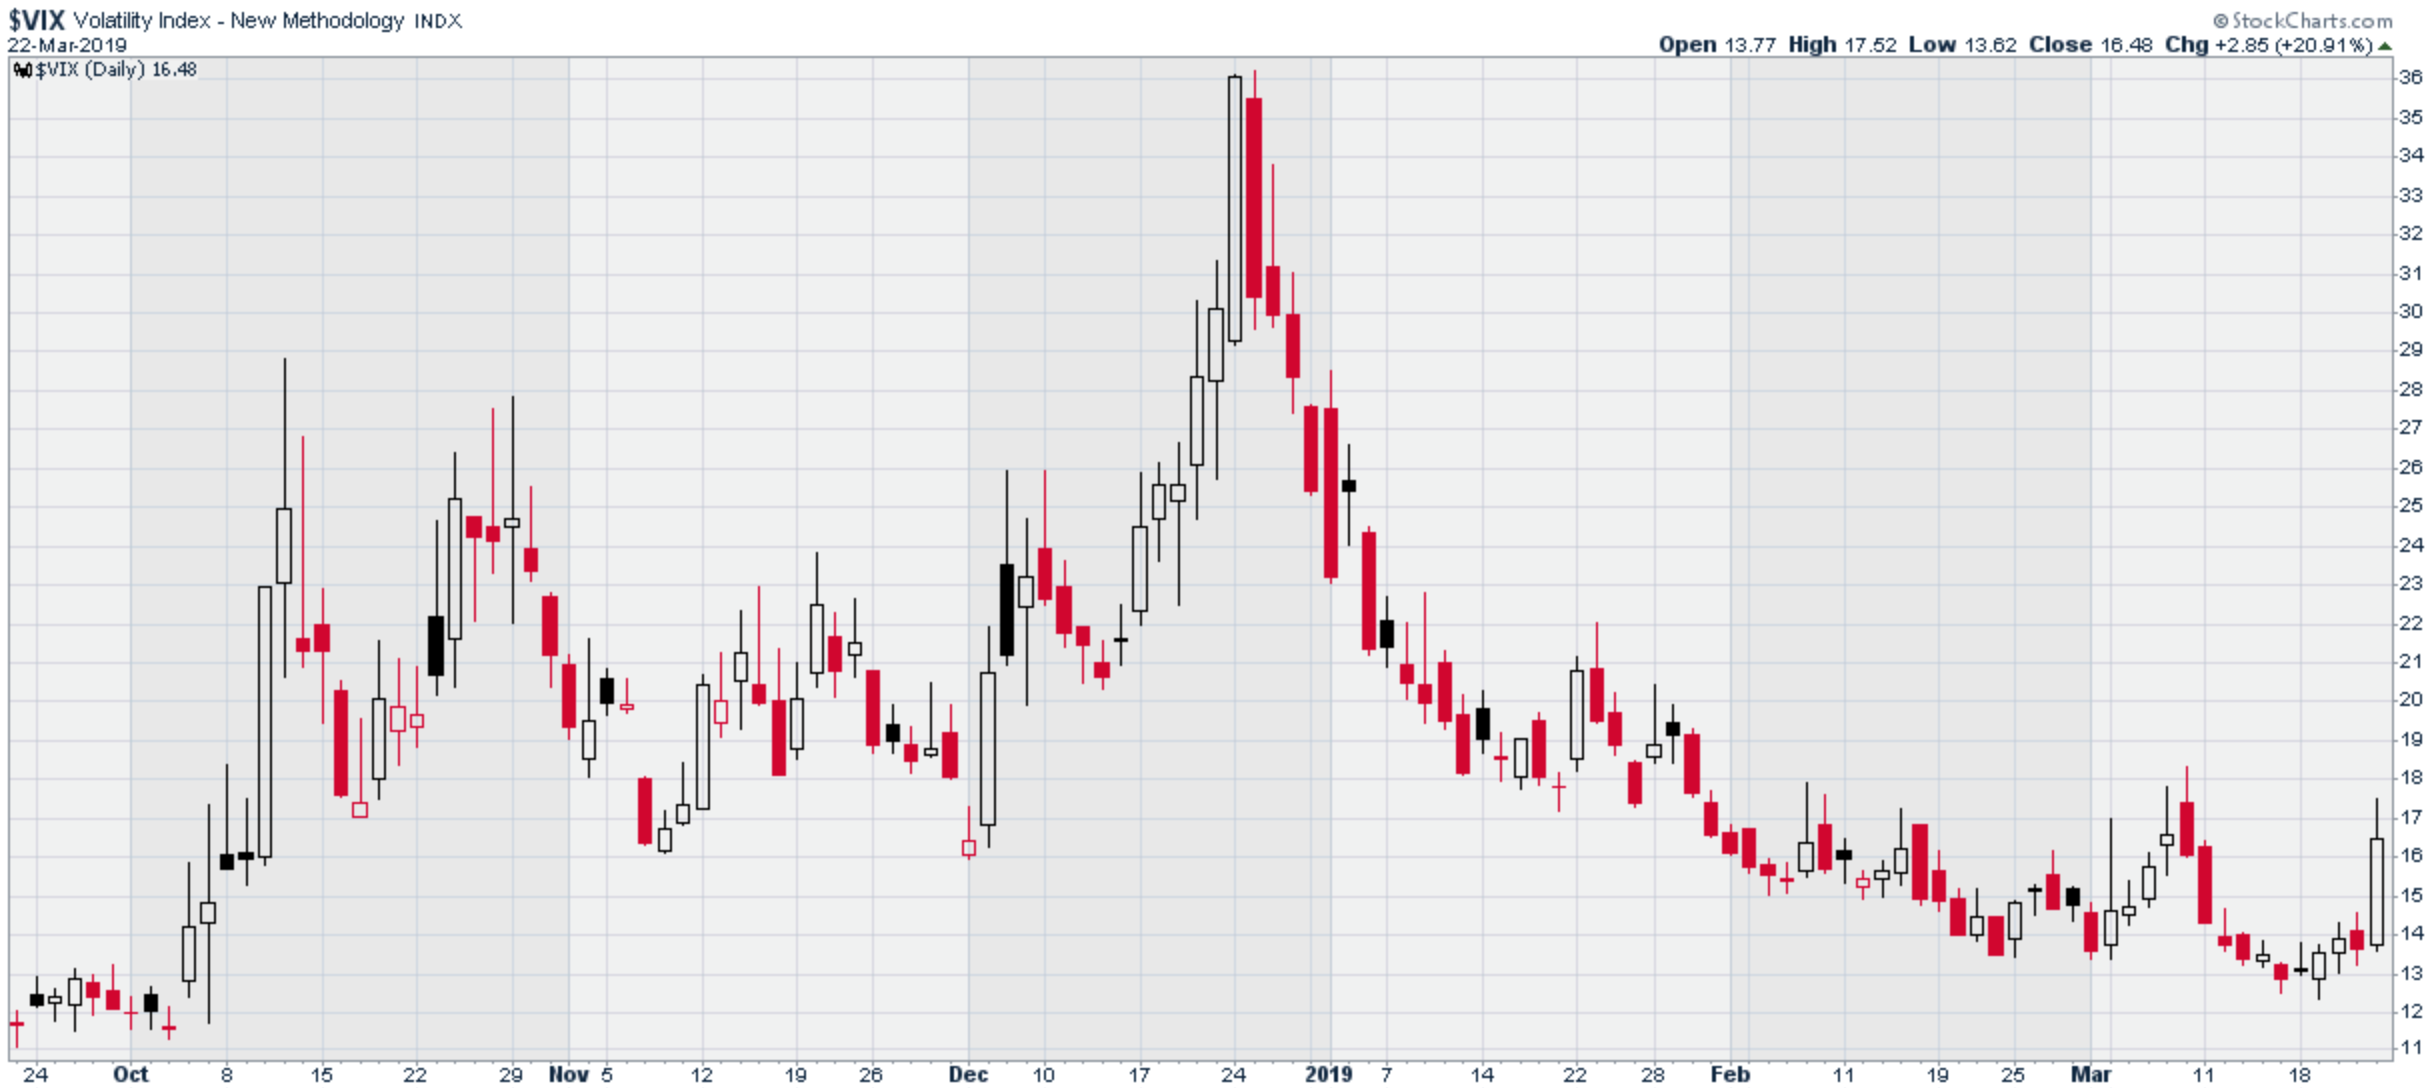
The Cboe Volatility Index (VIX) increased slowly this week and spiked up Friday to 17.5% before pulling back to close at 16.5%. This level of volatility doesn’t reflect panic mode, but it is moderately cautionary. Economic data and corporate earnings remain very positive, but the trade negotiations with China worry traders. The growing economic slowdown in Europe has raised concerns about possible negative effects on our economy.
CBOE SPX Volatility Index (VIX)
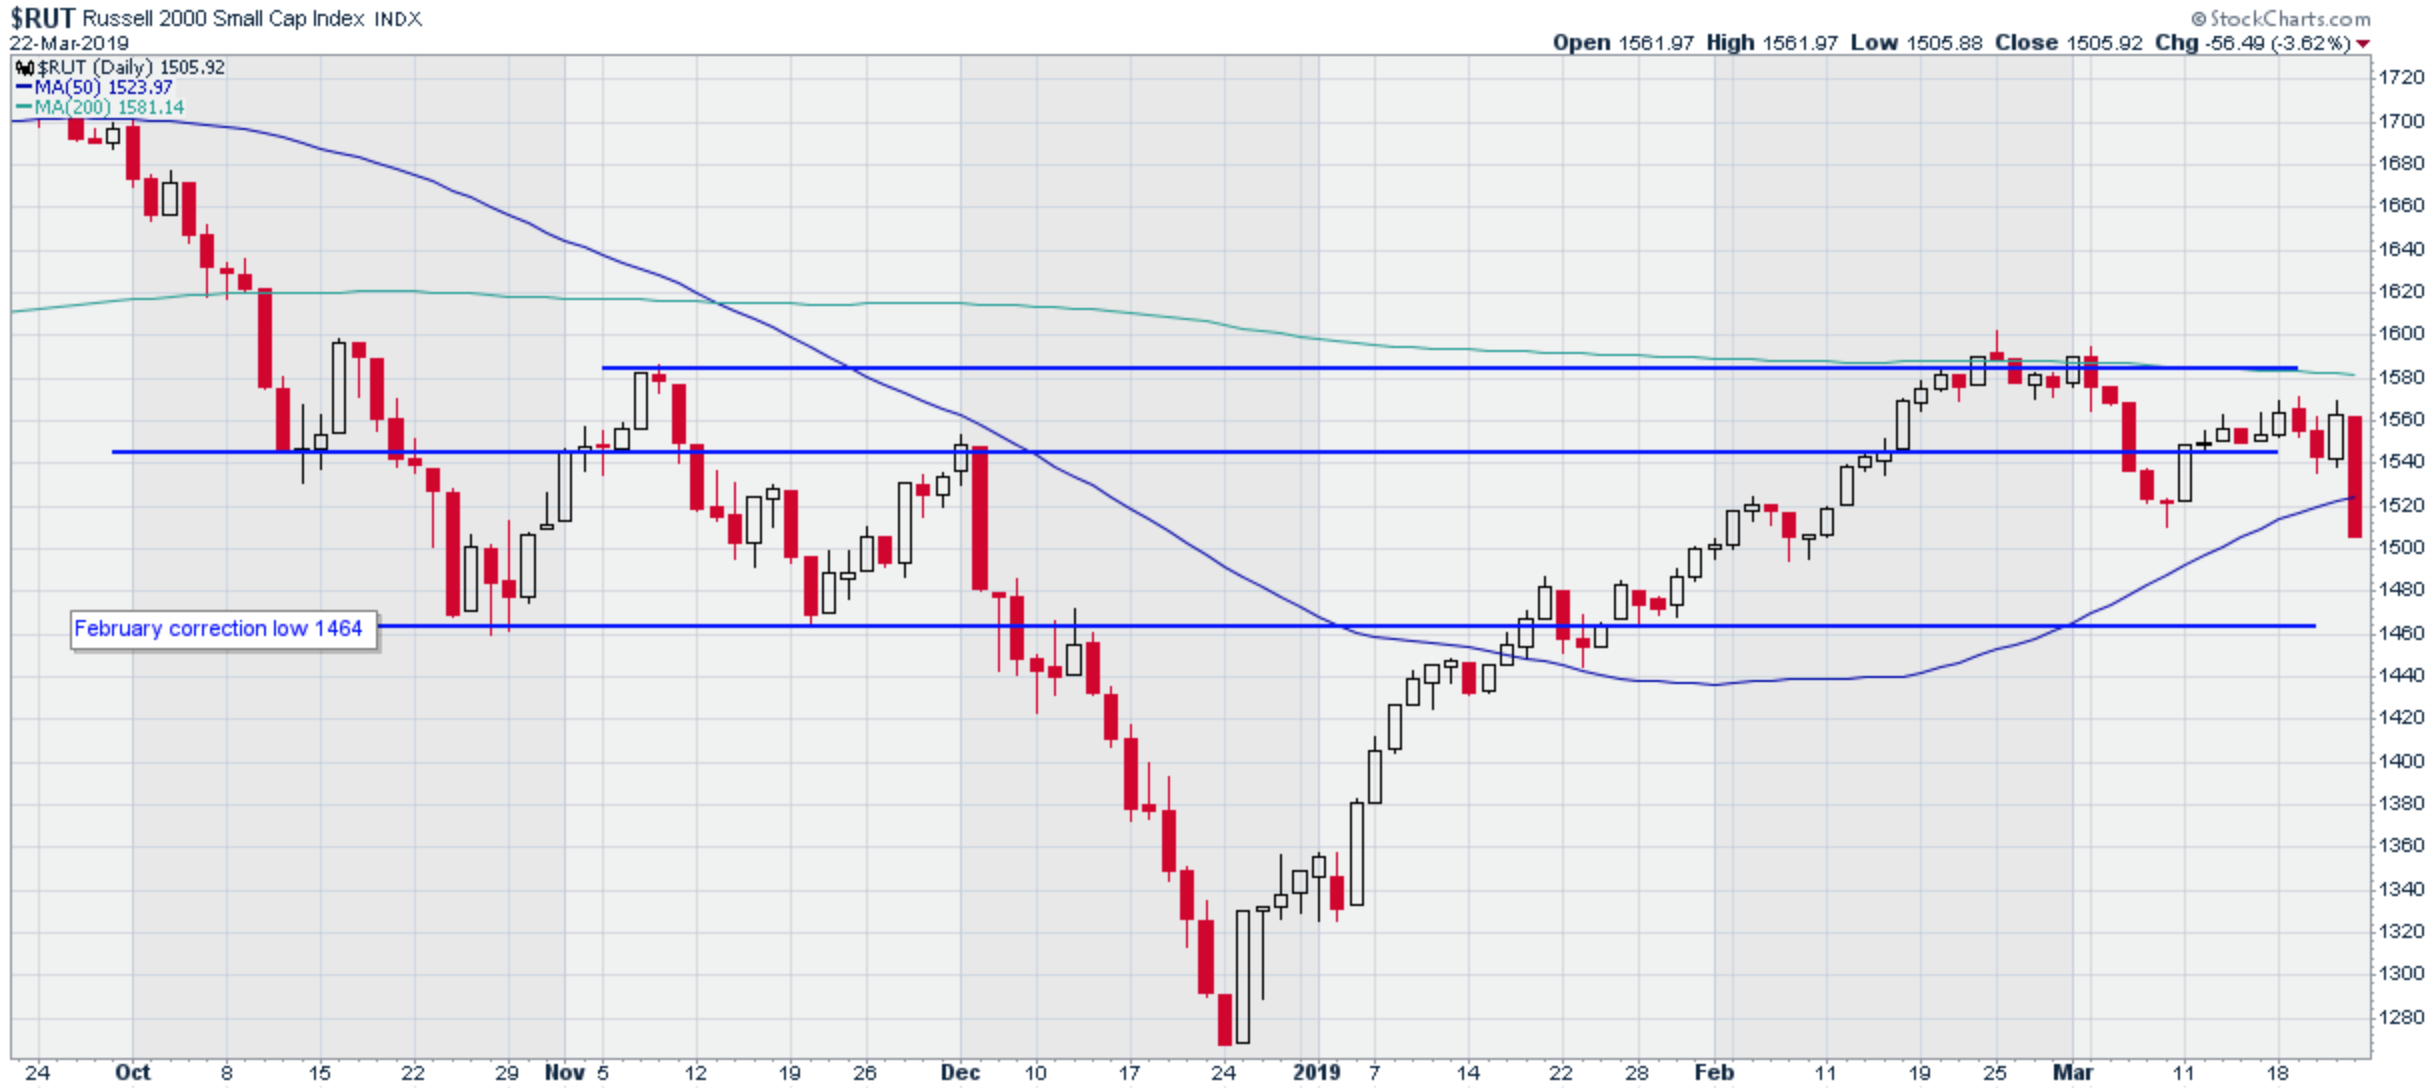
The Russell 2000 Index (RUT) continues to trade more weakly than the broad market. RUT never did break through the 200-day moving average, and after Friday’s sell off, Russell has even broken below its 50-day. Russell closed Friday at 1506, down 56 points or 3.6%. By contrast, the S&P 500 declined 1.9% on Friday. Russell’s weakness is the principal bearish signal for the current market.
Russell 2000 Index (RUT)
The NASDAQ Composite index closed Friday at 7643, down 196 points or 2.5%. NASDAQ remains well above its 200 dma at 7490, but remains far off of the September and October highs around 8100.
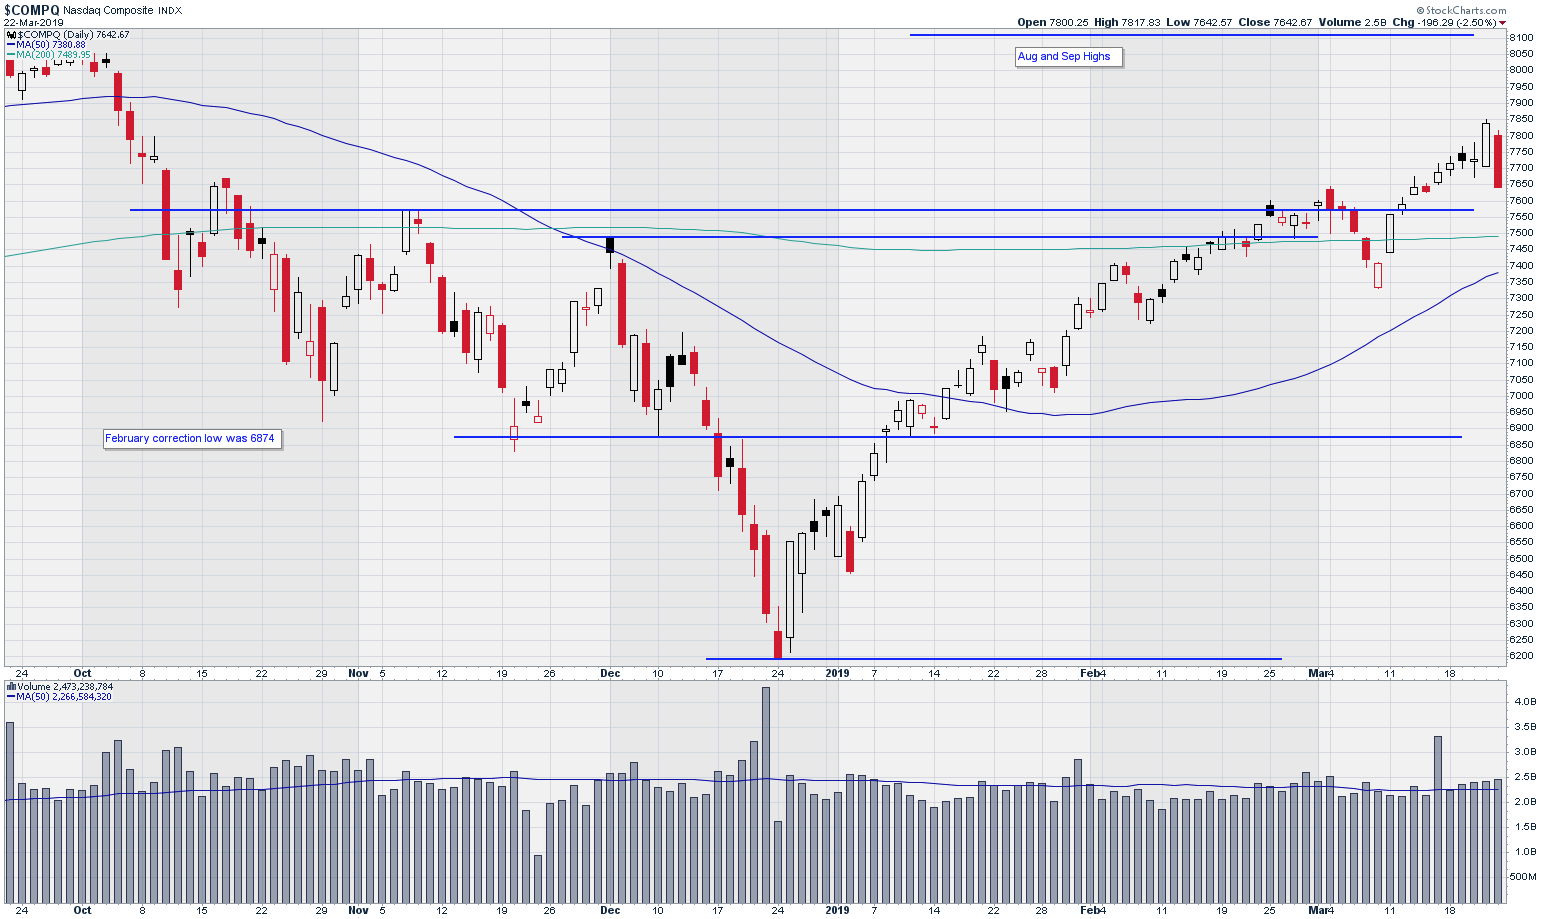
NASDAQ Composite Index
Trading volume in the NASDAQ stocks rose steadily this week and spent the last four days of the week above the 50-day moving average.
Corporate revenues and earnings reported during this earnings cycle have been excellent, but traders are worried about the Mueller probe, China trade negotiations, and slowing economic conditions in Europe. With the release of the Mueller investigation report Friday, we may put some of these anxieties to rest, although I expect much of the political turmoil to continue. The trade negotiations with China may be making progress, but that isn’t clear. This remains the primary concern for market analysts. All of these factors will result in continued market volatility.
A survey of individual stock performance on Friday showed that Chipotle Mexican Grill (CMG), The Hershey Co. (HSY), Eli Lilly (LLY), and Starbucks (SBUX) stood out among the carnage as a small number of stocks that turned in a price gain Friday. Those will be good trade candidates to watch as we monitor this market next week.
In volatile markets, the best advice is cautionary. When you face a choice in your investments, take the conservative path.


