

Recent volatility is likely to continued and can be exploited, notes Avi Gilburt.
The Fed, US-China trade war, potential impeachment hearings, Iranian aggression, North Korea firing missiles and slowing global growth; there are many issues worrying investors today. And, as the market experienced large gyrations these last two weeks, one excuse is paraded out after another.
When the market drops, pundits have a menu to choose from to blame it on. But last weekend, I noted:
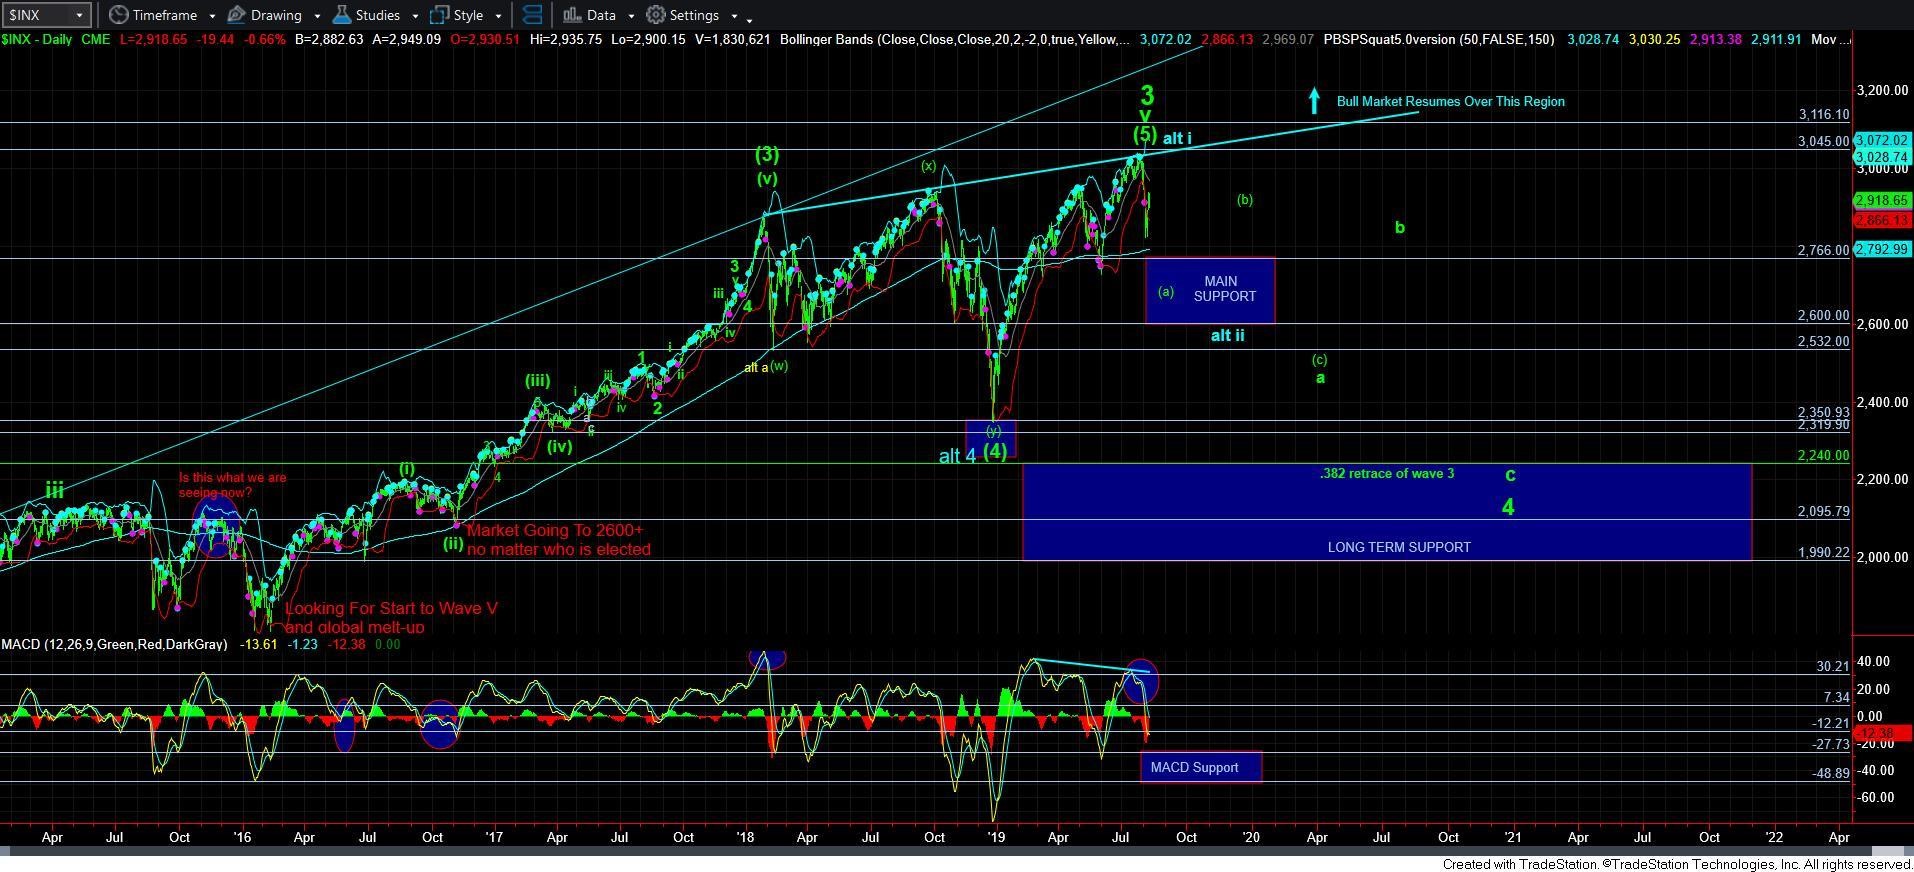
Major support resides between 2600-2766, and I think we will test that support over the coming weeks/months. So, strap yourself in, as it is likely going to be a wild ride.
This past week, the futures dropped to within 9 points of our major support region. I warned our members the evening we struck the 2775 low not to get too bearish since we are likely about to start a rally back up towards the 2930 region.
As we also noted on our charts and in my analysis, the ideal minimum target for this rally was the 2930. And, we clearly struck that region on Thursday, and retested it on Friday. So, it has been quite a wild week, but rather predictable thus far.
But I do not think we are yet done with the downside, if we hold cited resistance.
Investor sentiment drives market movement, which is what provides the “spin” to the interpretation of market news. And, investor sentiment is what we track using Elliott Wave analysis.
Yet, the media and pundits will continue to explain these market movements after the fact based upon their superficial understandings about the financial environment as they attempt to relate it to some supposed news event.
If our resistance region is respected, the structure presented to us suggests that the S&P 500 will next test the 2600-2685 region in the coming weeks.
In the smaller degree structure we track, the next time we break down below Friday’s low at 2899 it will likely open the door to the next decline phase pointing us to the 2600-85. While the market certainly may have topped at our minimum target (2930) for this rally struck on Friday, the upper resistance to the market resides between 2977-3004. But we will not get any initial confirmation that this rally has completed until we break below Friday’s low (see chart).
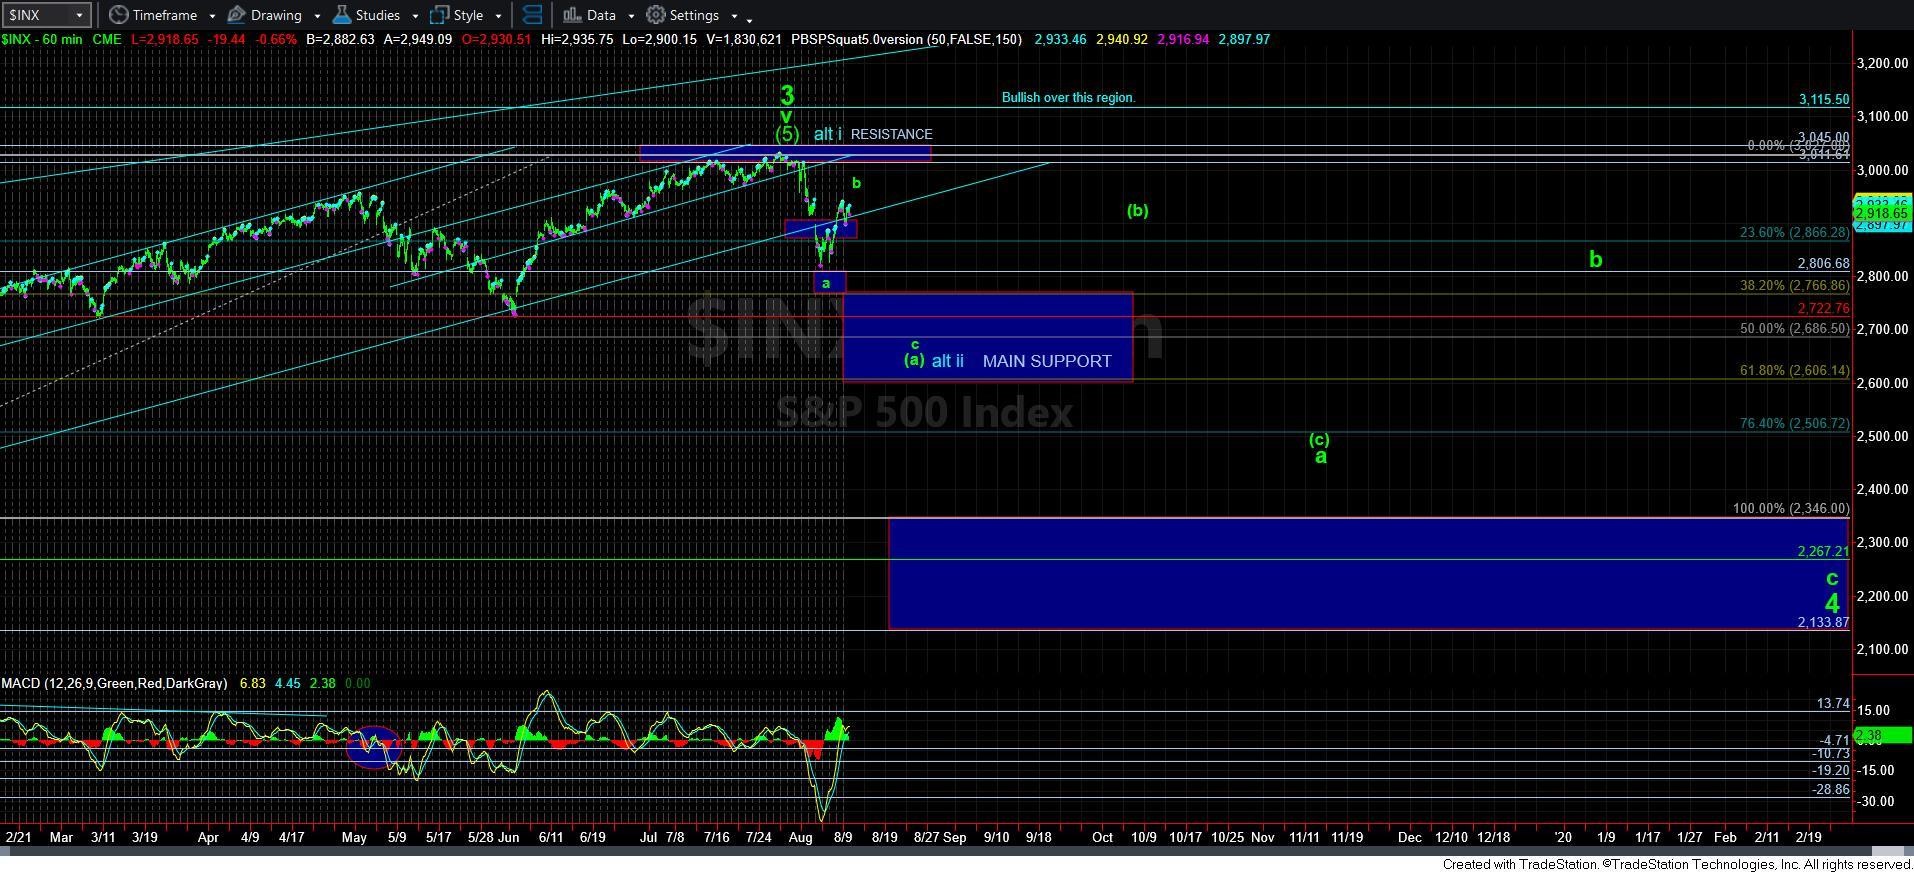
The one main point regarding the context of the current market is that we have likely entered a corrective wave structure. And, while impulsive structures are rather predictable, corrective structures are variable and much less predictable. This is why we see such whipsaw during corrective structures and I expect it to continue.
However, should we continue to drop to lower levels, please keep in mind that our major target for this bull market still resides in around 4000. That means that should we drop below 2700, we will have a target overhead that is almost 50% higher before this bull market completes. So, for those of you that are focused on the bigger picture, that means this next decline will begin to offer a sale. Moreover, that sale can even get better, as this correction can still be as deep as the 2200 region if we break below 2600 (see chart). But, when we are below 2700, the potential upside will be much greater than the potential downside, so you must focus upon that potential.
As the market gone largely sideways for the last 18 months, there has been much opportunity lost by those who simply “hold,” or “stay the course.” Moreover, the market could continue this type of action for as long as the next year. Much will depend on how the market progresses into the fall, and that will likely provide us with assurance of how the market will progress over the coming years.
Those that have followed our work raised some cash last fall when the market broke down below 2880. We then moved that money into the iShares 20+ Year Treasury Bond ETF (TLT) when it broke below 113.
At the time in early November of 2018, I noted that my ideal target for TLT was the 135/136 region. And, in my last update, I noted that I was going to sell my remaining TLT positions into my modified 138.50-140 target.
That means that, while many others were “holding,” or “staying the course,” we have now cashed in profits of more than 20% with the money we took out of the market last fall. I will now be looking to redeploy that cash into the stock market during this correction/pullback.
Avi Gilburt is a widely followed Elliott Wave analyst and founder of ElliottWaveTrader.net, a live trading room featuring his analysis on the S&P 500, precious metals, oil & USD, plus a team of analysts covering a range of other markets. He recently founded FATRADER.com, a live forum featuring some of the top fundamental analysts online today to showcase research and elevate discussion for traders & investors interested in fundamental rather than technical analysis.


