

The 30-year U.S. Treasury bond futures is near the bottom of a developing trading range after the August buy climax on its weekly chart. It should bounce here or soon, says Al Brooks.
The 30 year Treasury bond weekly futures chart formed a doji bar last week after the previous week’s big bear bar. This is a lack of follow-through selling and it is consistent with a developing trading range (see chart).
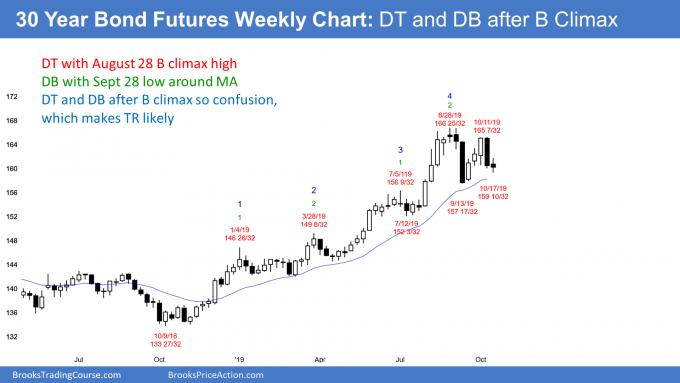
There have been two reversals down and one up since the August parabolic wedge buy climax. The bears have a double top and the bulls now have a double bottom. That is a trading range.
While the chart is trying to reverse, last week’s doji bar is a weak buy signal bar for this week. Therefore, there will probably be sellers not too far above this week’s high.
Trading range after August parabolic wedge buy climax
Traders expect the two-month trading range to continue for at least a few more weeks. On the daily chart (not shown), there is a micro wedge bottom over the past six days. The bulls expect a bounce next week.
If the rally stalls over the next couple weeks, which is likely, there will be a triangle on the daily chart. That is a Breakout Mode pattern. That means that there is about a 50% chance of either a successful bull or bear breakout. Furthermore, there is a 50% chance that the first breakout up or down will fail and reverse.
Traders expect limited movement up or down and more trading range price action over the next few weeks. They are buying around the current level, betting on at least a 50% retracement of the two-week selloff. Many will use a wide stop and scale in lower.
What about that double top and buy climax? The yearlong bull channel is tight. Also, the three-week rally into early October was surprisingly strong.
Most traders believe that the bears will need at least one more test up before they have a reasonable chance of a bear trend on the weekly chart. But if there are consecutive bear bars closing below the September low, the odds of a bear trend will go up.
Trading Room
Traders can see the end of the day bar-by-bar price action report by signing up for free at BrooksPriceAction.com. I talk about the detailed E-mini price action real-time throughout the day in the BrooksPriceAction.com trading room. We offer a two-day free trial.


