

The 30-year U.S. Treasury bond futures are putting in a high that will probably last 20 years, writes Al Brooks.
The 30-year U.S. Treasury bond futures market is continuing its collapse. But because the bull channel is tight, the current leg down will probably soon stall (see monthly chart below). The chart would then likely go sideways for a few months.
A couple months ago, some pundits on TV were saying, “Gold to infinity, interest rates to zero.” At the time, I said that this was nonsense and that just because something sounds clever does not make it true. It holds the interest of the TV audience and sells commercials, but it misleads the public.
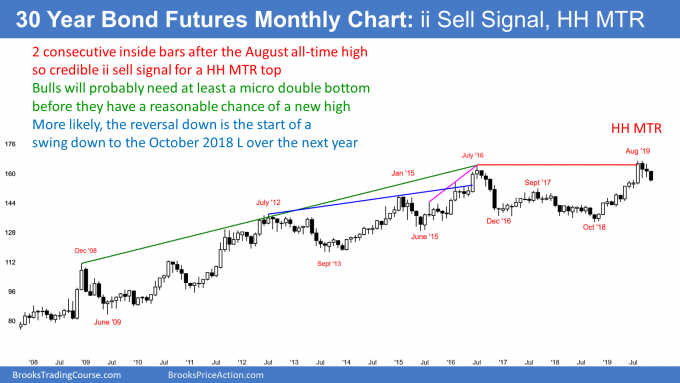
I have been saying for five years that the bond market was putting in a major top that will probably last 20 years. There were nested wedges on the monthly chart at the July 2016 high. Also, because the top is on the monthly chart, it might take years to complete. The 2019 rally was a test of that high. It is probably part of the topping process. The three-month reversal down is a higher high major trend reversal top.
This year the long bond broke above the 2016 nested wedge top. It is common for a wedge top to have a bull breakout and then a second reversal down. When that happens, the probability is high that there will be a significant reversal down.
Monthly sell signal triggered in November
There is an inside-inside (II) sell signal bar setup that triggered this month. October was an inside bar and it was inside of September’s range, which was also inside bar. When November fell below the October low, it triggered the II (consecutive inside bars) sell signal.
The bulls want November to close on its high. It would then be a High 1 bull flag buy signal bar for December.
However, the bears have a reliable top. If December goes above the November high, there will likely be more sellers than buyers up there. The best the bulls can probably get over the next several months is a trading range.
Now, there is a 60% chance that the August high will be the top for the next 20 years. But the parabolic wedge rally from the October 2018 low was in a tight bull channel. Therefore, there is a 40% chance that there will one more new high before the bear trend begins. That high, if it comes, will probably be brief.
First target for the bears?
The first targets after a buy climax typically are the 20-bar exponential moving average and the bottom of the final leg up in the buy climax. On the monthly chart, that is the big bull bar in August. Its low is 154-06. When the market gets there, it is usually also around the moving average as well.
Furthermore, traders should expect at least a couple legs sideways to down. Since this is a monthly chart, that would require at least several more months.
A tight bull channel does not suddenly reverse into a bear trend. Therefore, the three-month selloff will probably enter a trading range within a few months. That trading range could last five to 10 bars, which means a year. The bulls will see it as a bull flag. But since there is a reliable top, it is more likely be the first pause in a new bear trend.
U.S. Interest rates cannot go to zero
Can U.S. interest rates go to zero or below, like so many pundits have been predicting? No, I do not believe so (unless you are talking Fed Funds, that basically where at zero for eight years). This is because there already is a credible top in the bond market and therefore a bottom in interest rates.
More importantly, that is not how America works. Having zero interest rates is simply un-American. America sees itself as the leader of the world.
Most Americans would see zero interest rates as a sign of unacceptable failure. America borrows money (sells bonds) and the lenders (bond buyers) get nothing in return for helping us out? While it is fine for interbank lending, which the Fed Funds rate represents, is just too unfair and embarrassing for a benchmark rate.
Is America cheap and selfish? Have we mismanaged our economy so badly that the world is now frightened of economic collapse? It probably can’t go to zero because it is the only place right now globally to get yield.
Trading Room
Traders can see the end of the day bar-by-bar price action report by signing up for free at BrooksPriceAction.com. I talk about the detailed E-mini price action real-time throughout the day in the BrooksPriceAction.com trading room. We offer a two-day free trial.


