

The QuantCylcles Oscillator predicted a major down move in crude one year ago. What can we learn from it, asks Dan Collins.
It wouldn’t surprise you if we told you that the QuantCycles Oscillator is indicating that crude oil is extremely oversold on its long-term (monthly) chart; or its intermediate- or short-term oscillators for that matter.
However, John Rawlins, President and CEO, QuantCycles.com, thought that it would be valuable for us to share the current long-term chart (see below) as well as a monthly chart snapshot taken from a year ago.

As you can see from the current monthly oscillator, crude is extremely oversold and the oscillator expects a major move higher.
One might say, yes of course, but the markets—particularly crude oil—are being driven by a once in a generation event—the Coronavirus pandemic—and we should ignore cyclical indicators as they are being overridden by fundamentals.
That is why it is important to look at the long-term snapshot of crude from a year ago (see below).
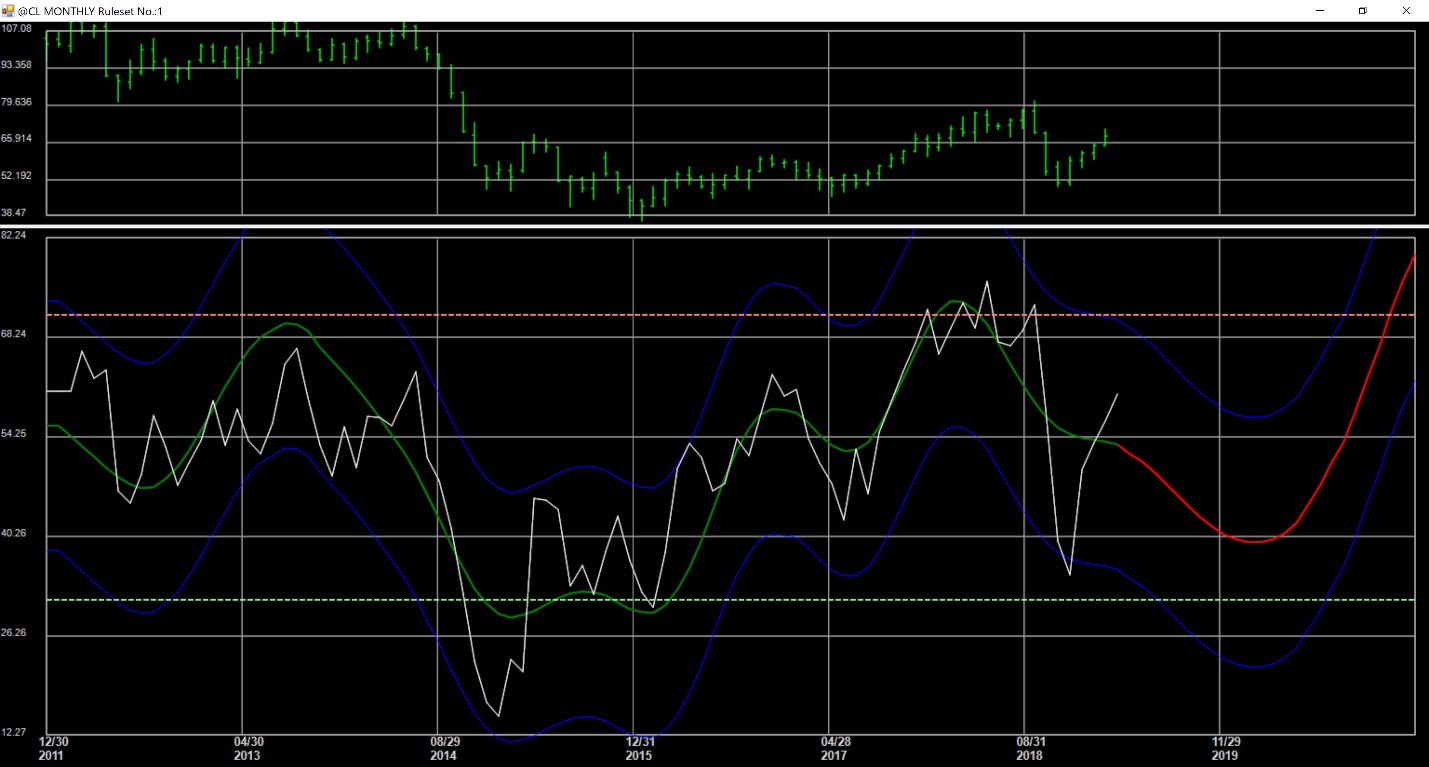
As you can see, the QuantCycles oscillator predicted a major bottom in crude around this time one year ago. It also, expected a major rally to follow.
It is important to point out that while QuantCycles uses the market data from futures markets; when it can, it draws on longer-term price data. The cycle data we are showing you dates back 100 years, not just to the relatively short (40-year) history of crude oil futures.
Rawlins is not trying to pat himself on the back here—just pointing out the power of the oscillator and the interplay between fundamentals and technical/cyclical research. “It's worth noting that long term cycle pressure was down and got exacerbated with all of the fundamental forces,” Rawlins says. “It is rare historically to see the extreme reached in the monthly chart. I was not trying to say that we forecasted crude to go to these levels just to say we were in a negative cyclic period and vulnerable to any kind of negative catalyst.”
That catalyst came in spades with the Coronavirus, coupled with the temper-tantrum from Saudi Arabian Crown Prince Mohammed bin Salman, aka MBS. MBS grew angry with Russia and the rest of the oil producing world for failing to comply with OPEC production cut recommendations, so like on the Thanksgiving Day 2014 OPEC meeting, Saudi/OPEC decided to pump more oil to drive the price down. This was an extremely ill-timed and ill-tempered move, given the reality Coronavirus the world was facing.
What is clear is the value of cyclical data. It has proven itself over the years. But when you can pair this data with strong fundamental news pushing a market in a major direction, you can capture historic moves.
The technical/cyclical data was sitting there looking for a catalyst. Like Al Brooks recently wrote regarding stocks: Coronavirus Pandemic Is an Excuse, Not the Fundamental Problem.
There was long-term technical weakness in stocks that when paired with strong fundamental drivers led to a historic move.
This is an important lesson whether you trade from a fundamental or technical perspective.
John Rawlins described the value of the QuantCycles Oscillator recently at The Orlando MoneyShow.
The QuantCycles indicator is a technical tool that employs proprietary statistical techniques and complex algorithms to filter multiple cycles from historical data, combines them to obtain cyclical information from price data and then gives a graphical representation of their predictive behavior (center line forecast). Other proprietary frequency techniques are then employed to obtain the cycles embedded in the prices. The upper and lower bands of the oscillator represent a two-standard deviation move from the predictive price band and are indicative of extreme overbought/oversold conditions.


