

While the euro’s rally is near exhaustion level, its strength indicates a larger uptrend, reports Al Brooks.
The EURUSD currency pair rallied for three weeks. However, the daily chart has an exhaustive buy climax (see below). Traders expect a pullback for a few days next week.
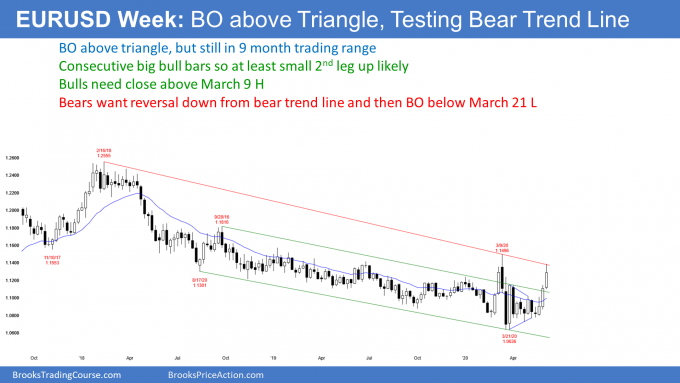
The EURUSD weekly chart had a second consecutive big bull trend bar last week. This is a reversal up from a higher low major trend reversal. The bars are surprisingly strong. A Bull Surprise typically has at least a small second leg up. Consequently, the bulls will buy the first one- to two-week pullback.
Monthly chart triggered an IOI buy signal in May
The monthly EURUSD chart triggered a buy signal in May when it went above the April high. April was an inside bar after a big outside bar; inside-outside-inside (IOI) pattern, which is a Breakout Mode setup (see chart below). There is now a two-month bull breakout.
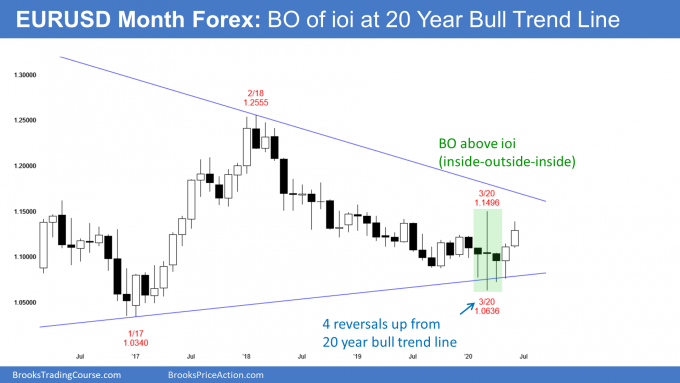
The monthly chart is rallying from a higher low compared to the January 2017 low. Traders see the two-year bear channel as a bull flag. The past two months are testing the bear trendline at the top of that bull flag.
If the bulls can get a monthly close above the March high, they will expect the rally to continue up to the September 2018 high. That was the start of the bear channel. That is always a target when there is a reversal up from a Spike and Channel Bear Trend. The bear spike was the April and May selloff in 2018.
Buy climax on the daily chart
The rally on the daily chart has been exceptionally strong (see below). After breaking above the neckline of a head and shoulders bottom, the EURUSD rallied to above the measured move target.
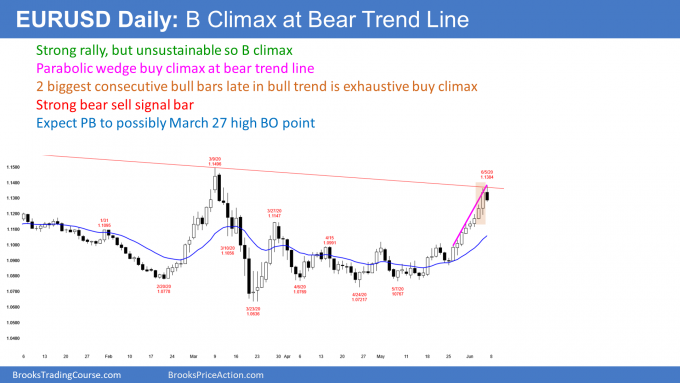
However, Thursday’s range was particularly big. Also, Wednesday was a fairly big bull day as well. When there is a surge like this late in a bull trend, it tends to attract profit takers. There is a 60% chance that the EURUSD will begin to pull back next week or after one more brief leg up.
Traders expect a pullback to test the breakout point
This is a strong break above this neckline of a head and shoulders bottom. Traders usually expect a pullback to the neckline of the bottom. However, that is the May 1 high and it might be too far below. The bulls might buy aggressively before a pullback reaches that breakout point.
A common target for a selloff after a buy climax is the bottom of the most recent climactic rally. That is Wednesday’s low. It is near the March 27 high, which is another breakout point. Traders should expect a pullback to begin next week.
It is important to note that the three-week rally was exceptionally strong. When that is the case, traders expect a second leg up. Therefore, traders will buy a pullback to around Wednesday’s low, the March 27 high, and the 20-day exponential moving average. The bears will need at least a micro double top before traders can get more than a one-week pullback.
Trading Room
Traders can see the end of the day bar-by-bar price action report by signing up for free at BrooksPriceAction.com. I talk about the detailed E-mini price action real-time throughout the day in the BrooksPriceAction.com trading room. We offer a two-day free trial.


