
There is a potential triangulation between the dollar, euro and Japanese yen based on QuantCycle analytics.
The QuantCycles Oscillator is showing an interesting divergence in the U.S. Dollar vs. two of the largest major currencies.
EURUSD
After a slow steady two-year decline, the EURUSD currency pair has rebounded over the last several weeks. While the rally hasn’t matched the spike in March, or signaled a major reversal of trend, it has pushed the long-term (weekly) QuantCycles Oscillator into overbought territory (see chart).
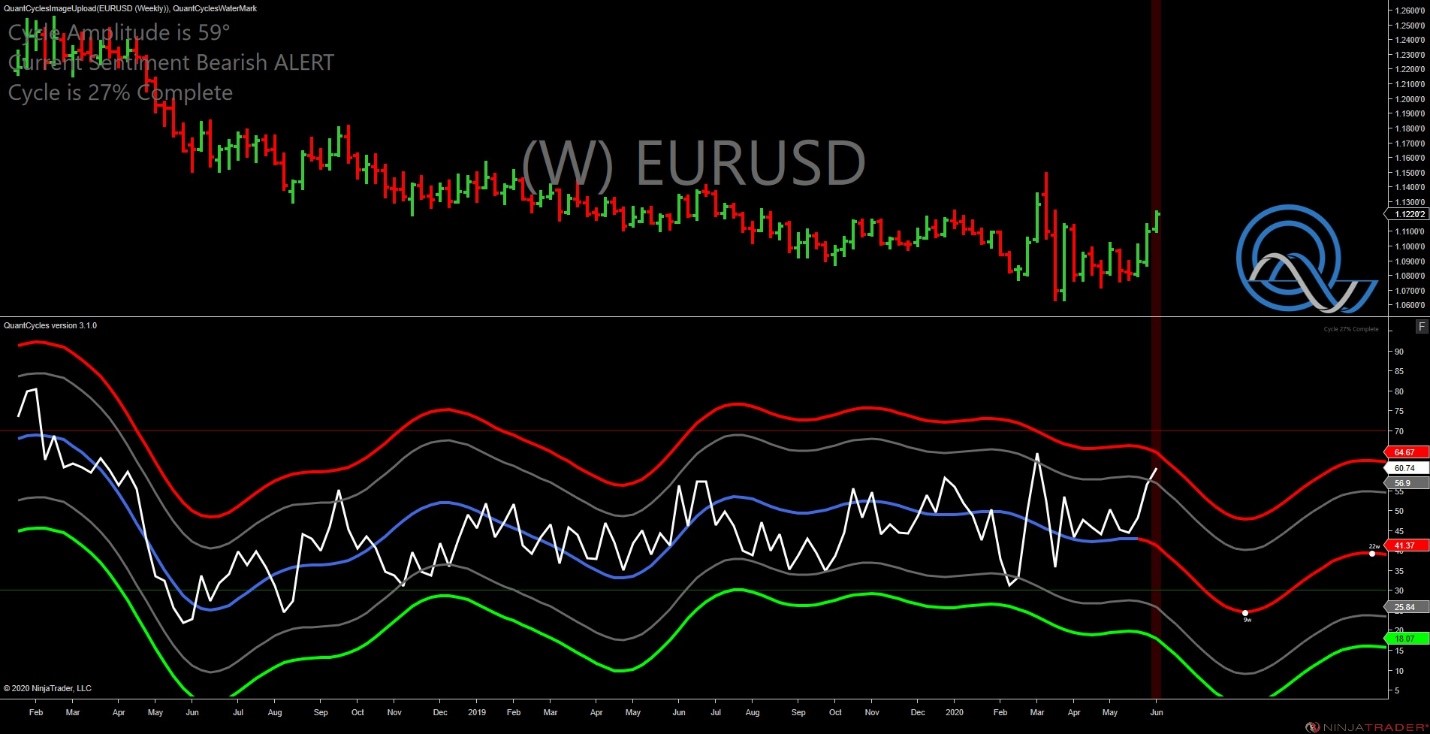
As you can see, the oscillator is suggesting a significant downurn over the next several weeks.
While the daily oscillator is not nearly as bullish, it doesn’t really have to be to signal a trade as price action over the last 10 days has pushed it into extreme overbought territory (see chart).

While a trader may be tempted to wait for a test of the March high, this is a strong sell signal.
USDYPY
The USDJPY pair has moved higher in two separate waves after its historic March sell-off. The first wave was a clear v-shaped moved, while the second wave has been much more gradual.
The move over the last several days has pushed the daily oscillator near extreme overbought territory (see below).
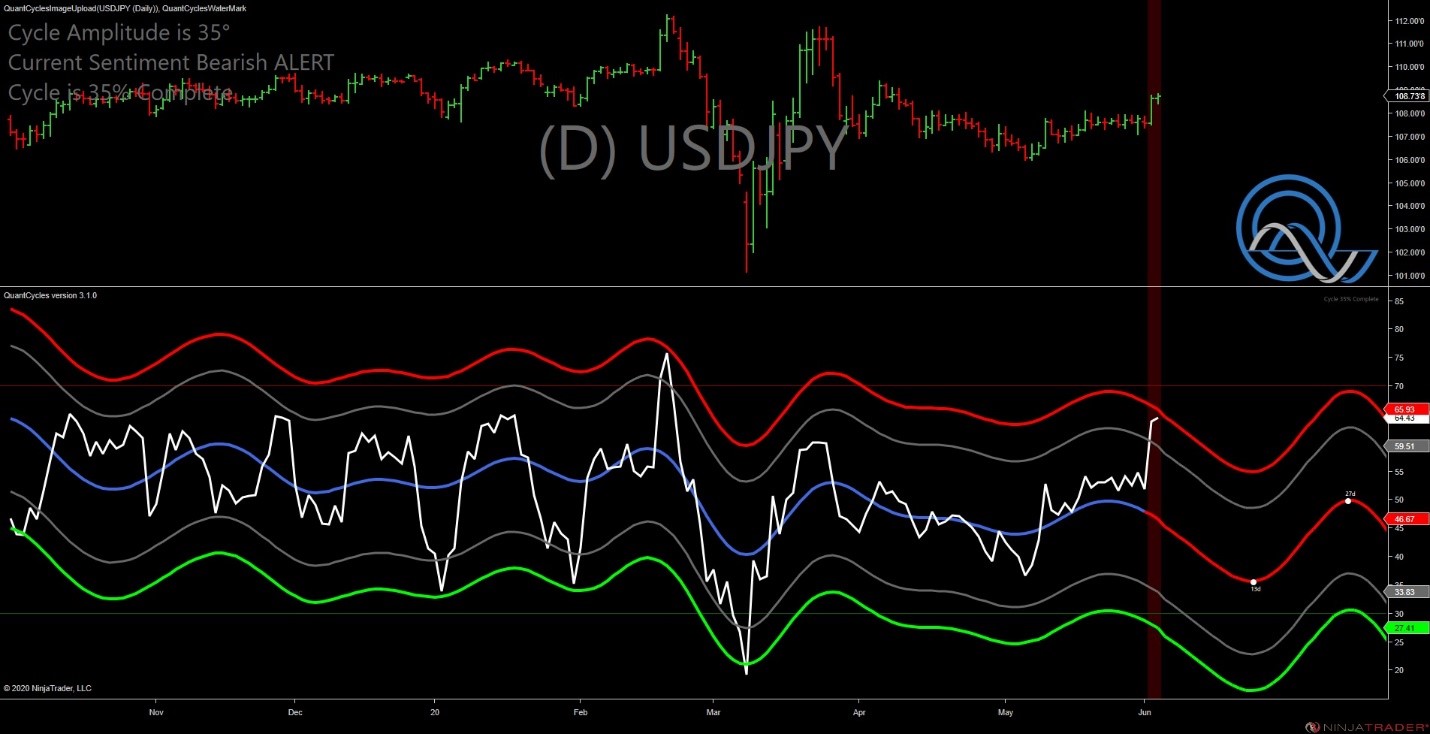
As you can see the oscillator is predicting a downward move in the USDJPY for the remainder of the month of June.
The long-term (weekly) oscillator confirms this move, and timeframe (see below).
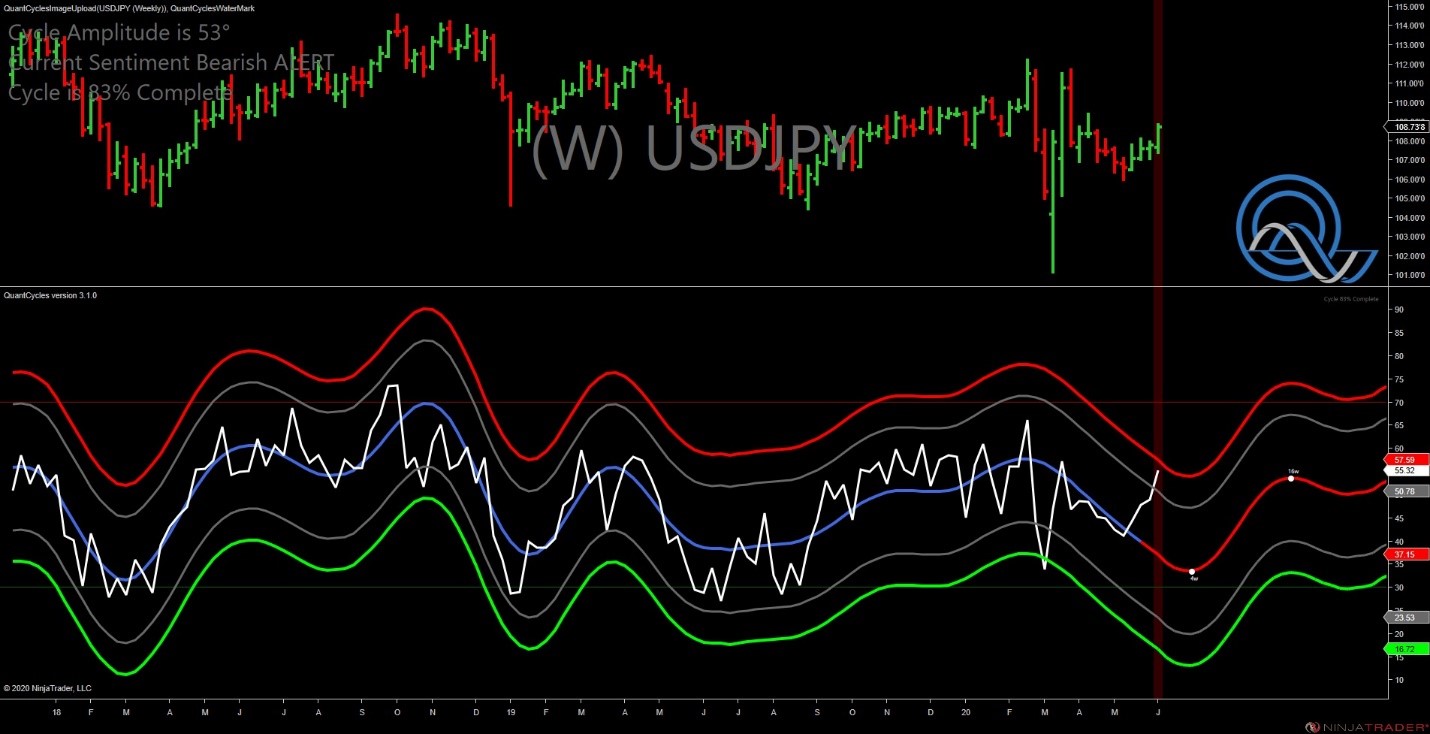
While there is a clear confluence of opinion, the pair is expected to rebound sharply later in the summer so you will want to book profits and tighten stops as the trade goes in your direction.
A Better Trade?
What is clear from both these pairs is the euro is in a massive up move vs. the yen. The EURJPY has recently set a yearlong high. This followed a more than two-year downward trend in the EURJP.
Perhaps a better trade would be to look for a downward correction in the EURJPY, however, it is still a long way off a strong support area so you may be better off trading them vs the dollar.
John Rawlins described the value of the QuantCycles Oscillator recently at The Orlando MoneyShow.
The QuantCycles indicator is a technical tool that employs proprietary statistical techniques and complex algorithms to filter multiple cycles from historical data, combines them to obtain cyclical information from price data and then gives a graphical representation of their predictive behavior (center line forecast). Other proprietary frequency techniques are then employed to obtain the cycles embedded in the prices. The upper and lower bands of the oscillator represent a two-standard deviation move from the predictive price band and are indicative of extreme overbought/oversold conditions.


