

The grain market has forged a counter-seasonal rally for the record books. However, in the course of the rally, we have seen near-record net-short positions held by speculators over the summer flip to net long positions of concerning proportions, says Carley Garner of DeCarleyTrading.com.
Simply put, market speculators went from being heavily short the market to heavily long. Yet, when most speculators are on the same side of the trade the market acts like a teeter-totter shifting momentum in the other direction. Similarly, our friends at Bullish Consensus Index have reported industry insiders polled have shifted from a mere 20% bullish opinion to nearly 75% bullish. This means the bulls have likely already taken action and the upside from here could be limited. That said, it is an indicator not the end-all-be-all of market speculation.
In addition to what appears to be exuberant optimism regarding grain prices, a weekly chart of soybean futures reveals a cold hard reality. While soybeans could continue at the current pace, because in 2020 anything is possible, the odds are against it. This particular rally has been impressive outpacing the 2017 and 2018 rallies. Yet, in 2016 soybeans exploded to $12.00 only to collapse to under $10.00 in the coming weeks. The RSI (Relative Strength Index) is also overstretched at a reading of about 75.0. This isn’t a death sentence for a rally, but it is a sign that things might have gotten carried away. Should prices reverse in the coming weeks as we anticipate, the downside target would be $10.50 per bushel.
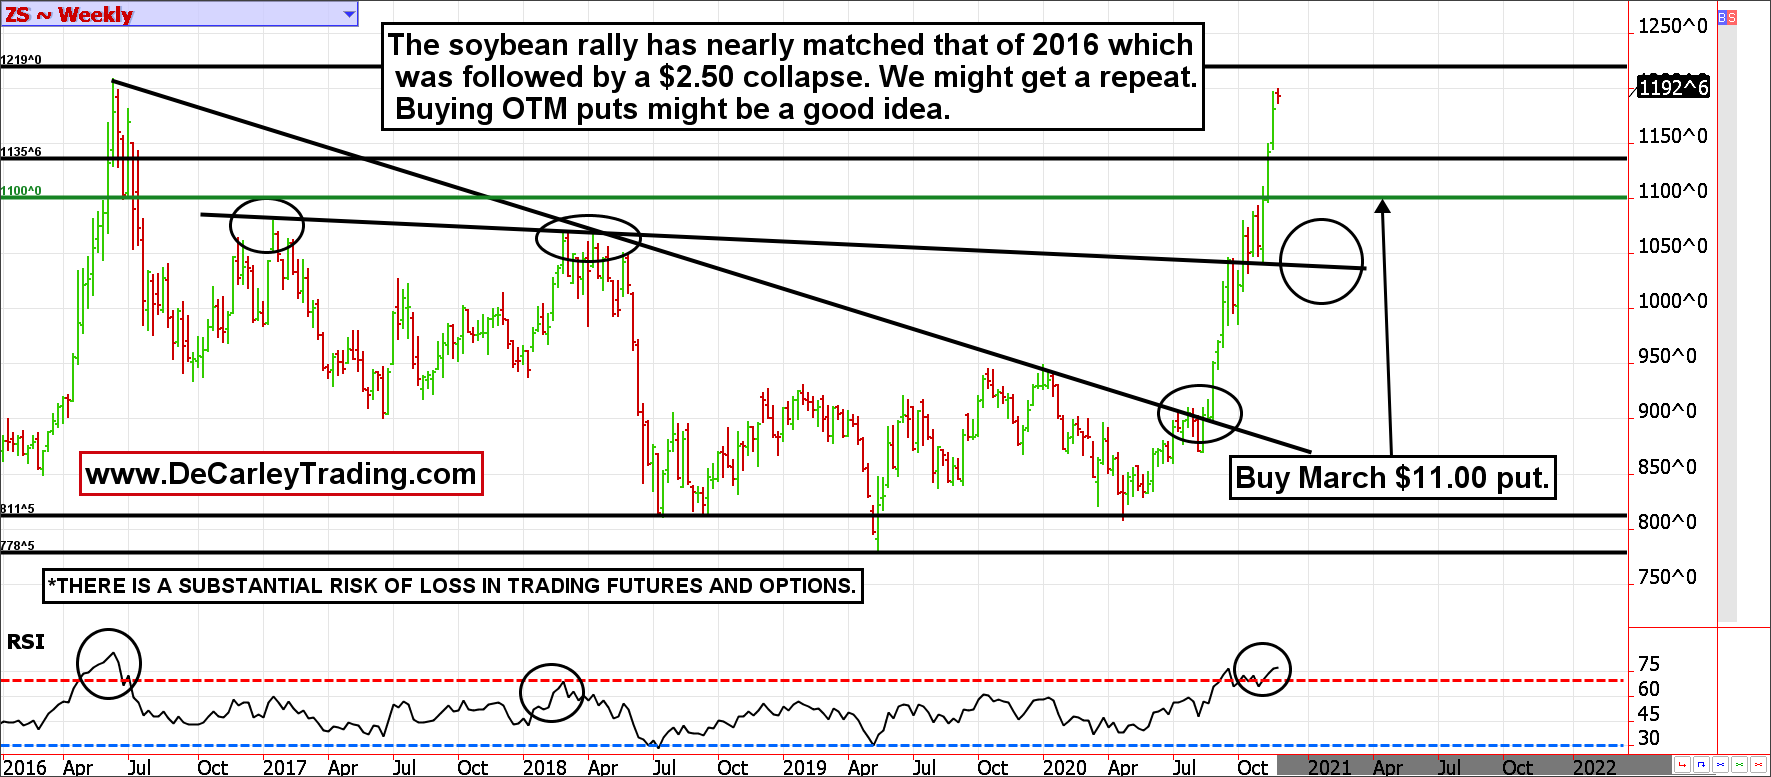
We are bearish in the grains at this point but we aren't insane...and are old enough to remember the 2008 wheat rally to $13.00 per bushel that nearly bankrupted one of the largest brokerages in the business (due to a rogue trader). With that memory in the back of our minds, we like the idea of playing the downside in grains with conservative positions, more importantly, limited risk. For instance, in soybeans, it is possible to buy the March $11.00 put for about 12.5 cents or $625. This option requires that soybeans sell off sharply from here to payoff, but given the chart pattern, it seems there is at least a 75% chance of that happening. If not, the most the trade can lose is the cost of entry (about $625). This option has 88 days to expiration, that is plenty of time for the market to come back down to reality. This option was trading near 25 to 30 cents just two weeks ago. A return to that level would see a profit of about $600 to $900 per lot, so that would be a worthy profit target. That said, the profit potential is theoretically wide open should the market completely melt down.
Carley Garner is the senior strategist for DeCarley Trading, a division of Zaner, where she also works as a broker. She authors widely distributed e-newsletters; for your free subscription visit DeCarleyTrading.com. She has written four books, the latest is titled Higher Probability Commodity Trading (July 2016).


