

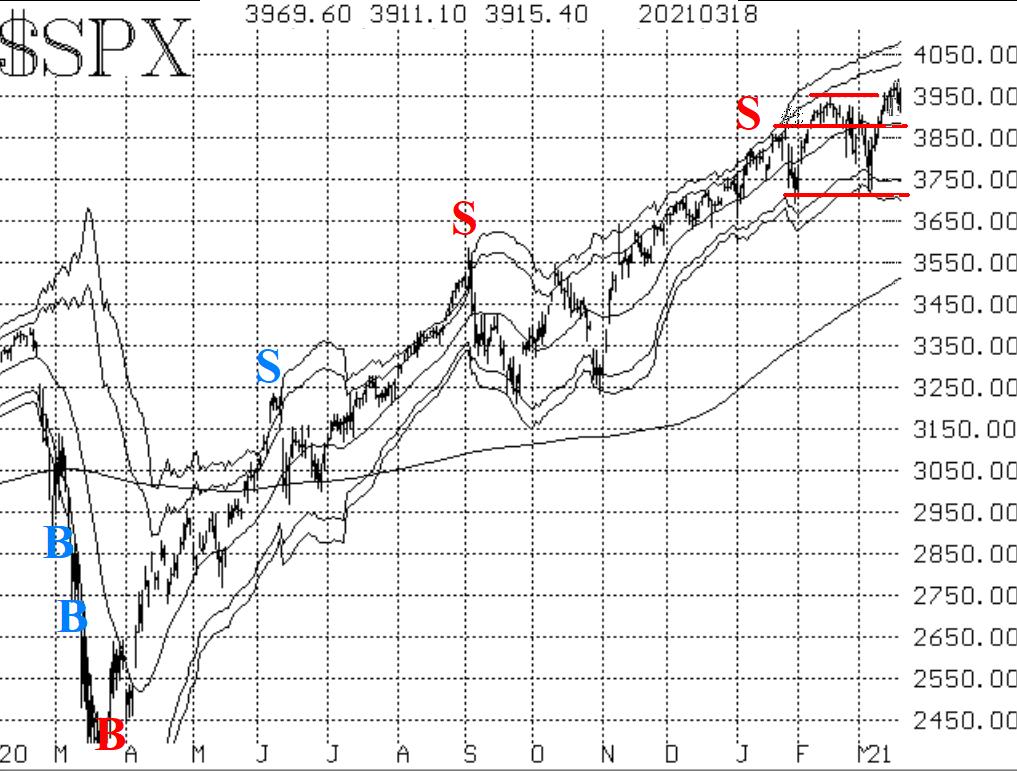
At face value, it appears that the bulls may be having trouble holding onto the gains from the upside breakout to new highs by S&P 500 (SPX), states Larry McMillan of Option Strategist.
A closer look shows the glaring discrepancy between the Dow (DJX) and the NASDAQ-100 (QQQ). The Dow was the first of the major indices to register a new all-time high. NASDAQ-100 (NDX) has lagged badly behind, having last made a new all-time high in mid-February. SPX is caught somewhere in the middle, because it has all the Dow stocks in it and most of the NDX stocks as well.
In any case, SPX is back inside its old trading range of 3870 3950. That should provide support, but if SPX closes below 3870, then the recent upside breakout would have to be declared a "false breakout" and a more bearish stance adopted.
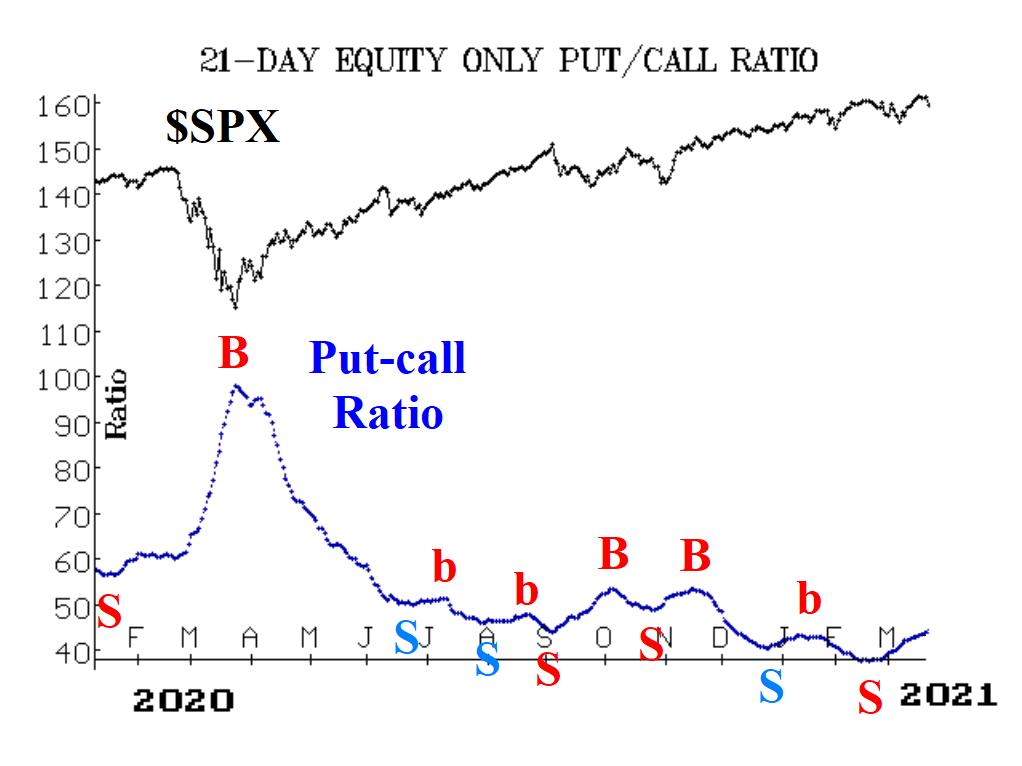

Equity-only put-call ratios continue to rise, meaning that they are still on sell signals. While these may not have been the "best" sell signals in terms of the SPX chart, they are quite accurate in terms of the NASDAQ chart.
Market breadth has deteriorated badly ending the week, and both breadth oscillators gave sell signals as of the close of trading on March 18.
Volatility generally remains in the bullish camp. The VIX "spike peak" buy signal is still in effect and will be as long as VIX does not re-enter "spiking" mode. Moreover, the trend of VIX is down, as both CBOE SPX Volatility Index (VIX) and its 20-day moving average are below the declining 200-day moving average.
In summary, the majority of the indicators are still bullish, but not all. We are maintaining a "core" bullish position but will take small counter-positions if sell signals arise.
To learn more about Larry McMillan, visit Option Strategist.


