

And to all this negativity, I say...RUBBISH!
Previously I spelled out this bearish argument was devoid of logic and borderline comical. Here it is once again because I don’t believe I could explain it any better:
What is a “Taper Tantrum”?
This is an overdone stock market sell off that begins when the Fed first signals that they plan to take actions that will raise rates. This gets some hyperactive traders to start selling immediately because they foresee that the tide has turned and there will be more Fed actions to raise rates in the future.
This reaction sounds logical on the surface. But is completely insane given all historical reference points, which we will dig into below.
More to the point, when the Fed shifts to a more hawkish view (less accommodation with higher rates likely to follow) the stock market typically goes up for two-three more years afterwards. That is the norm.
In this case, rates are so far below normal...that it may take a lot longer than two-three years for higher rates to cramp the economy and stock market. Thus, to have any kind of sell off now is irrational and borderline insane.
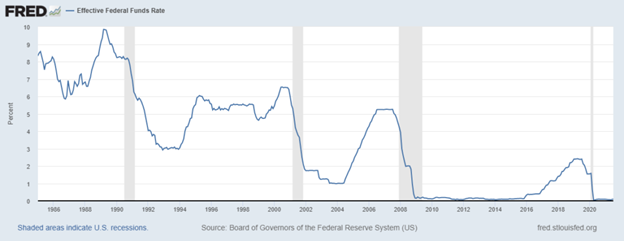
Here is a chart going back over 35 years and four bear markets (the gray vertical bars). See how long before the bear markets arrive that the Fed starts moving rates higher. And see how high rates had to go before the bear market began. Meaning the ticker tantrum sell off last week was a downright JOKE. Thus, not a surprise how quickly stocks have rebounded since.
Then it begs the question; Why do these illogical market reactions happen so often?
It comes down to the difference between traders and investors. In particular, day traders and computer-based trading is a world view compressed to just seconds and minutes. That is opposed to the months or years that the typical investor contemplates.
When your time horizon is that compacted, then you are hyper vigilant to the headlines. There the view becomes binary such as:
More Fed accommodation = Buy
Less Fed accommodation = Sell
These decisions are instant and reflexive with no care or concern for the longer-term ramifications. Indeed, looking at the chart above, last week’s sell off would be like bailing out of the stock market 1994 at the first sign of Fed rate hikes even though there was six more years of glorious stock gains to follow.
Just to solidify the point, below is the chart, which shows the value of the stock market if it was on par with the yield of 10-year Treasuries. This is an important chart because as you will see on the left side, the stock market has been relatively on par with that valuation model between 1979 and 2001. So now picture how much more rates would have to rise to call into question the value of the stock market and end this bull run.
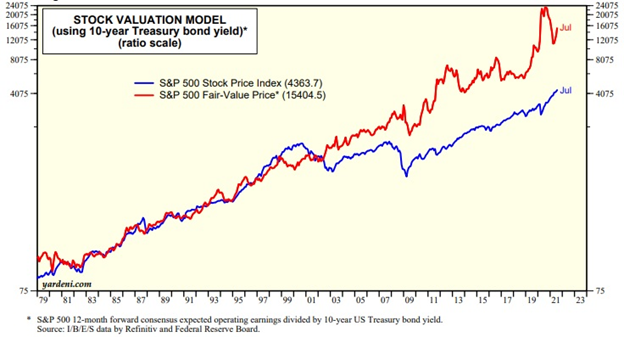
(9/28/21 Edit: This chart may be from end of July numbers, but even with rates up to 1.55% the stock market is still the OBSCENELY better value at this stage).
I think you see my point. That rates are so incredibly low creating an undeniable value story for stocks that will NOT be undone anytime soon.
This does not mean to take a second mortgage on your house to put in the stock market.
This does not mean the stock market will just go up and up and up.
This does not mean that there will not be other extended sell offs here or there along the way.
It simply means that the long-term market outlook is bullish til proven otherwise. And to undo that we would need to see some great threat to the economy that meant recession with subsequent bear market. Virtually nothing taking place right now points to that outcome, which is why a bullish bias is warranted.
Having that clear-eyed view in place allowed us to unflinchingly stay in our stocks during the taper tantrum to enjoy some pretty impressive gains since.”
(End of 8/24/21 commentary)
At this stage I just see a lot of pinballing action between the key resistance and support lines. Here is the updated moving average levels:
4,444 = 50-day moving average (which is where the S&P hung out the previous 3 sessions)
4,342 = 100-day moving average (Tuesday’s intraday low of 4,346 flirted with this level)
4,128 = 200-day moving average (not likely to make it down here...but every now and then the market needs a good house cleaning to shake off complacency. This kind of drop would certainly be that wake-up call. Yet still plenty of time for stocks to make it to about 4700-4800 before the year ends).
In general, economic activity continues to be solid including the PMI Flash at 54.5 with manufacturing much more impressive at 60.5. This strength was corroborated in the Durable Goods report Monday at 1.8% vs. the 0.4% increase that was expected.
This manufacturing strength displayed in these two reports is good to know as some of the lesser followed regional manufacturing reports (KC, Dallas & Richmond) each showed month over month declining growth. So, for now I would assume the former reports provide a more accurate read as to what is happening on a national level.
All in all, the preponderance of the evidence remains bullish. And even when we have nasty negative sessions as we have today the lesson learned is to hold onto the reigns of the bull market. That’s because you don’t want to be on the sidelines when it starts to run higher once again.
Portfolio Update
We have now beaten the S&P for six straight sessions. And in that time our portfolio has gained +4.69%, which embarrasses the -0.11% return for the S&P.
Given the recent history of the market’s volatility that likely means things will switch up and we may be on the underside for a little while. That is not so tough to endure when you know that our patience in the past has paid off handsomely. So we learn to just do it again and again for our long-term benefit.
Now let’s check in to see how some of our individual positions are doing.
Rates on the Move (TBT): I spent a good deal of time last week talking about the movement of rates along with recent hawkish changes to Fed comments. Amazingly on day one of the announcement, rates stayed frozen. Since then, they 10-year rates have been moving aggressively higher from (1.33% up to 1.55%). And yes, with that TBT is finally enjoying long overdue gains including a +3.08% today alone.
Yes, predicting what happens next for rates has proven quite tricky. But when you know that the long-term average for 10-year rates is 3.5 to 4%, and the Fed has signaled a more hawkish view, then it says to just hold on expecting tailwinds in your favor in the weeks and months ahead.
Boyd Gaming (BYD): I have read some articles noting the surge in cases from the Delta variant are ebbing lower, which is raising confidence in many of the consumer discretionary concepts that include social contact. BYD is certainly in that camp, which explains the big rally in shares Monday. Hopefully this trend continues pointing out the effectiveness of our timing into shares.
US Global Jets (JETS): These shares were downright frozen for far too long. Now with the same catalyst noted for BYD above, investors are appreciating the recovery of the airline industry. As such we are finally seeing these shares take off. Note the all-time high is around $32. That is 33% above current levels. So, when you understand that most other stocks are about 50% above their pre-Covid highs and JETS is 33% lower than its highs...then yes the odds of outperformance for JETS is very, very good.
Kulicke & Soffa (KLIC): Semiconductors have been battered and bruised of late. Yet when you appreciate that chips are still in short supply in many sectors of technology, then the demand to buy equipment to add capacity is high. That is why the analyst from DA Davidson was not shy in raising his target for KLIC to $100. That should bolster our desire to hold onto shares through this turbulence for a bigger payday ahead.
J2 Global (JCOM): Slipped all the way down to about 80% during all the market volatility. Gladly held onto the reins with shares now back closer to 100% gain since inception. Yet given the average target of $183, along with string of impressive earnings beats, then we will continue to hold on expecting even more upside.
Best Buy (BBY): The 5-Star analyst from Piper Sandler on Monday said essentially “stop the insanity!”. Meaning why on earth is BBY shares faltering when their outlook is so spectacular??? With that was a reiterated Buy rating. In fact, he is calling it one of his best ideas and more than happy to affix a $150 target. This got shares bouncing back +5.2% on Monday. But with shares only at $109 as of the close Tuesday, there's plenty more room to run higher.
Group 1 Auto (GPI): Shares have closed above $200 for two straight sessions. Would not be surprised with a bit of consolidation around this level. However, with their last quarterly earning being downright AMAZING then we owe it to ourselves to see what they have up their sleeve the next time around. If more earnings momentum is in the offing, then shares should soar above $200 and we'll be quite happy we didn’t peel out too early with lesser profits.
Schneider National (SNDR): Stealthily carving out gains and now our newest double digit winner. Heck, it almost was in positive territory Tuesday fighting off all the bloodshed levied on most others. One more earnings report like last quarter and other investors will find it harder and harder not to massively pay up for these attractive shares.
Learn more about Steve Reitmeister at StockNews.com.


