

When this highly profitable strategy was first shared in Way of the Trader, I expected a flurry of interest to follow. To be honest the strategy was mostly greeted with a shrug, states Ian Murphy of MurphyTrading.com.
Numerous traders confided in me that they skipped over the strategy because it appeared to be too complicated. In hindsight the explanation of how the strategy works was too detailed and a more streamlined explanation would have been appropriate.
For some reason the strategy has taken off this year and an expanding group of serious traders are taking every trigger without fail. This newfound interest appears to come down to a handful of things:
(a) Traders have realized that by looking directly at every stock in a market, which is making new highs and lows, a change in market direction can be spotted before the move manifests on an index, and the difference can be profitably exploited. Obviously, not every trigger works out (as we saw this week) but the win rate and risk-to-reward ratio are such that the strategy is very profitable over the long run.
(b) The strategy is perfect for part-time traders because you don’t have to scan through endless lists of stocks everyday looking for setups. You can repeatedly trade the same instrument and some traders I’ve spoken to have just one instrument listed on their platform now.
(c) Triggers usually occur after setting up for a day or two, so traders expect to make the trade and it doesn’t occur out of the blue when they are otherwise engaged. Coincidentally we are currently in this “setting up” phase.
(d) Entry and exit levels on the strategy are clearly identifiable in advance, which means a trader’s exposure and risk are super easy to calculate.
(e) Following the launch of Micro E-Mini futures in May 2019 interest in the strategy picked up generally but traders classified as “retail” in the EU have really taken to the Micros because they are unable to access US-listed ETFs. A single Micro contract on the S&P 500 currently costs about $21,850 and can be traded for less than 50 cents. When leverage is added to the mix successful triggers can really offer a bang for your buck.
(f) You don’t have to import and chart third-party data to your platform to trade the strategy. In fact, most traders never do. If you look at the raw new high and low data, that’s enough. I import and plot the data for demonstration purposes, but also because I use the same data for market internal and leading market indicators.
(g) Some traders have simplified the strategy by excluding the two VIX reversal signals. This may lead to a higher rate of false positive triggers, but we are monitoring the results and the change may not lead to a marked decline in profitability as expected.
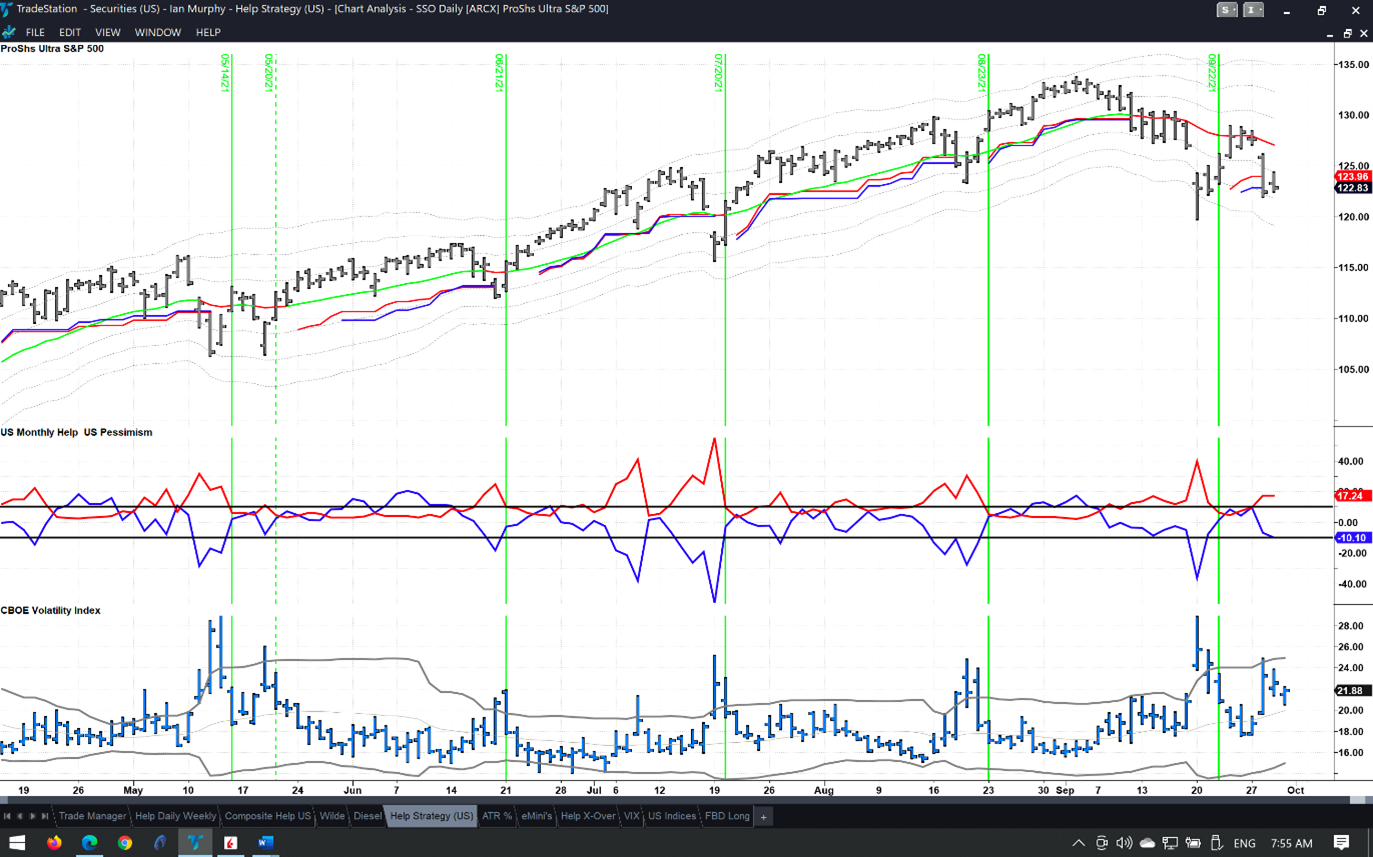
Recent triggers on the strategy are shown with vertical green lines above and even a quick glance at the chart reveals how the strategy works. Interestingly, traders who are squeezing the most money out of the strategy are doing so based on how they manage trades in terms of risk and leverage. The green lines are opportunities available to all, but the most successful traders have figured out how to leverage these opportunities.
Weekly Trend Following Strategy
On September 15 we looked at a possible weekly trade in Intel (INTC) and the note finished with the following, ‘On Friday afternoon before the close, this week’s price bar will have to be positive and green, and preferably closing above the EMA at $55.19 for me to stay in the position over the weekend.’
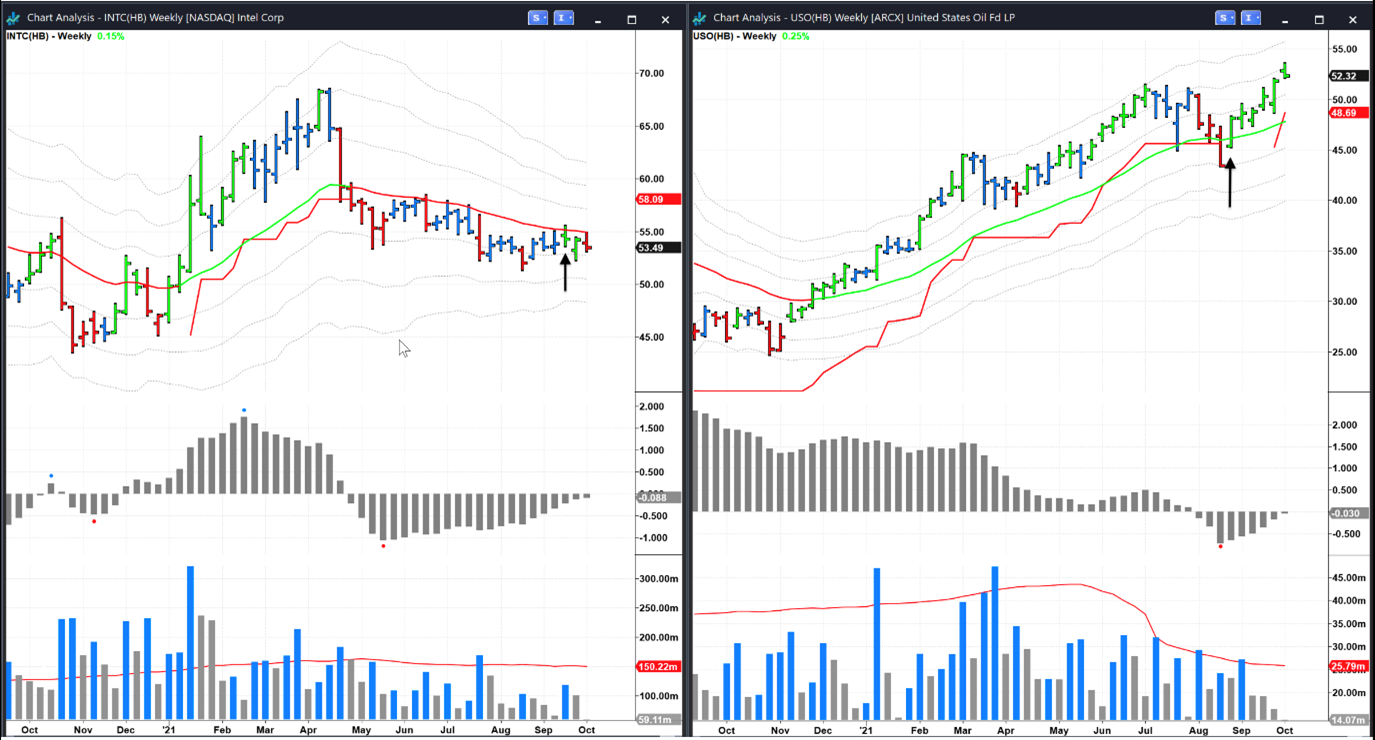
The price bar did not end the week positive and closed below the EMA (black arrow, left chart), so the trigger did not confirm, and the trade was not a runner. Now it goes back on the watch list.
Oil, gas, and the energy sector in general have been in the news of late and we looked at the large US ETF (USO) in the June newsletter. It pulled back in July and August with two stabs down before reversing in a two-bar washout (arrow) and breaking out this month. Based on last week’s low, the trailing stop is currently at $45.26.
FBD Strategy
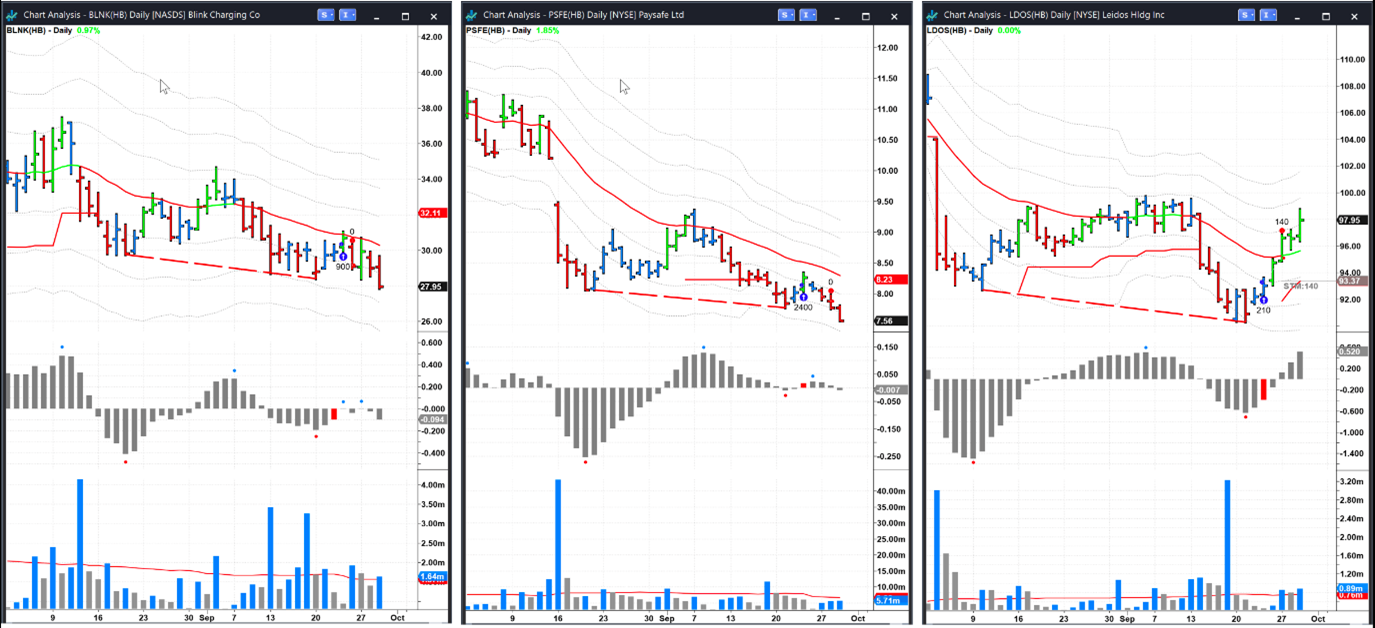
The recent selloff in equities means only a handful of daily swing-trading triggers appeared on the screener. Three trades were taken using this strategy last week (blue arrows) and the results were a mixed bag. Two were stopped out quickly (red dots) when the required bounce never materialized, and the position in Leidos Holding (LDOS) is still open with a trailing stop, which has moved above the entry price. The trick with this strategy is to realize the stock will either take off quickly or not at all, so a tight stop is always used.
Learn more about Ian Murphy at MurphyTrading.com.


