

US equity markets will be closed today in observance of Martin Luther King Day, so let’s use the opportunity to review how global equity markets have fared since the year began, states Ian Murphy of MurphyTrading.com.
End-of-Day (EOD) data from Yahoo Finance and Investing.com
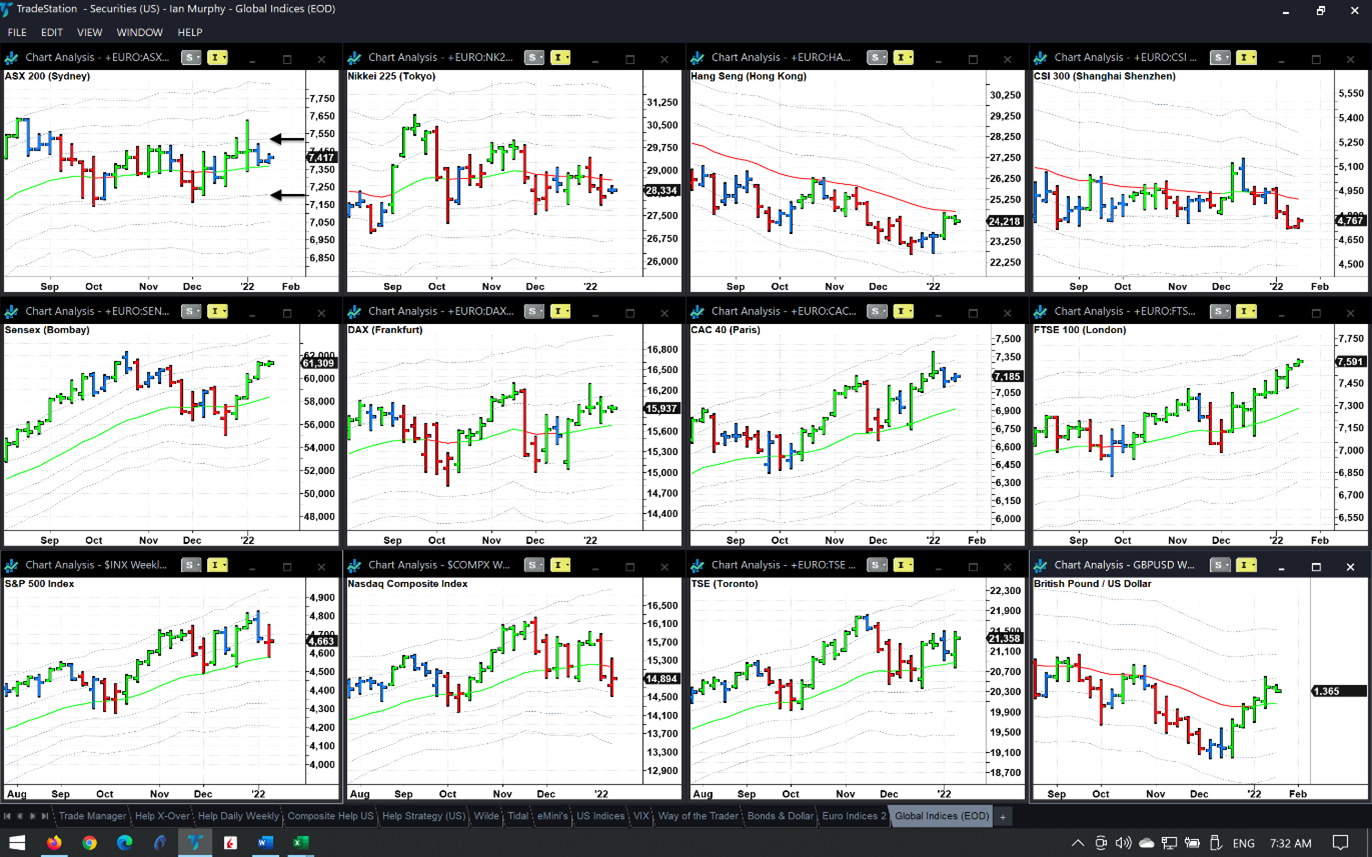
Beginning on the top left with Australian equities, the black arrows show the 1ATR and -1ATR lines on these weekly charts. Anything trading above the top arrow is technically bullish, below the bottom arrow is bearish. Aussie equities have been in the neutral zone since last September, basically going nowhere and threading water. The picture is mirrored in Japan but with a slightly more bearish tone, as demonstrated by the red color in the center 21EMA line. Hong Kong is firmly bearish, making lower lows and lower highs in a classic downtrend with a red EMA the whole way down—mainland China is not far behind.
India is bullish, Germany is neutral with a bullish slant, while France and the UK are clearly bullish. The recent strength of the pound against the dollar (bottom right chart) makes this bull run even more attractive. The S&P 500 (SPX) is back in the neutral zone as is the NASDAQ, which is looking more bearish. Canada is holding up well since 2022 began.
Money managers have identified European equities as attractive for the year ahead because the ECB is expected to hold off on interest rate increases longer than the Fed.
Learn more about Ian Murphy at MurphyTrading.com.


