

The selloff in equities has rattled people, and throughout January commentators questioned should market participants sell now while they can, hold on for the recovery, or buy the dip, notes Ian Murphy of MurphyTrading.com.
My approach is always the same. When invested in the financial markets we should never find ourselves in a situation where we don’t know what to do. We shouldn’t make decisions when the event is unfolding, by then is often too late. We should always have a clearly documented trade plan before we open a position, so we know in advance what to do if things go south, then it’s just a matter of following through on the original plan. A trade plan offers a clear course of action and avoids having to make important financial decisions under pressure.
If we are currently holding equities (or ETFs) for a multi-year timeframe using a passive buy-and-hold approach, then we should sit tight and do nothing right now (assuming the instruments we are invested in are highly liquid and solid). If we are actively managing the position, we need to ask: are we using a daily, weekly, or a monthly chart? Where is the protective stop order (there should always be one on actively managed positions) and why is the stop located where we have it? (Tip: the location should be based on historic realized volatility.) If we can’t answer these three basic questions, then we don’t have a plan and we should stand aside until we do.
In short, when the market enters a correction, we should run fast or not at all, and the decision on when to run should be made long before the selloff begins.
Is it a bear?
A correction in the S&P 500 (SPX) was confirmed last Monday when the broad-based index declined more than 10% from its previous high. Since then, it has trended sideways with increased volatility as evidenced by the range (height) of the price bars. It’s well known that markets alternate between bullish and bearish cycles, but the sentiment change is usually accompanied by a shift in volatility also. This results in protective stops being hit if they were originally placed based on a fixed percentage below the entry price, something which magnifies the volatility.
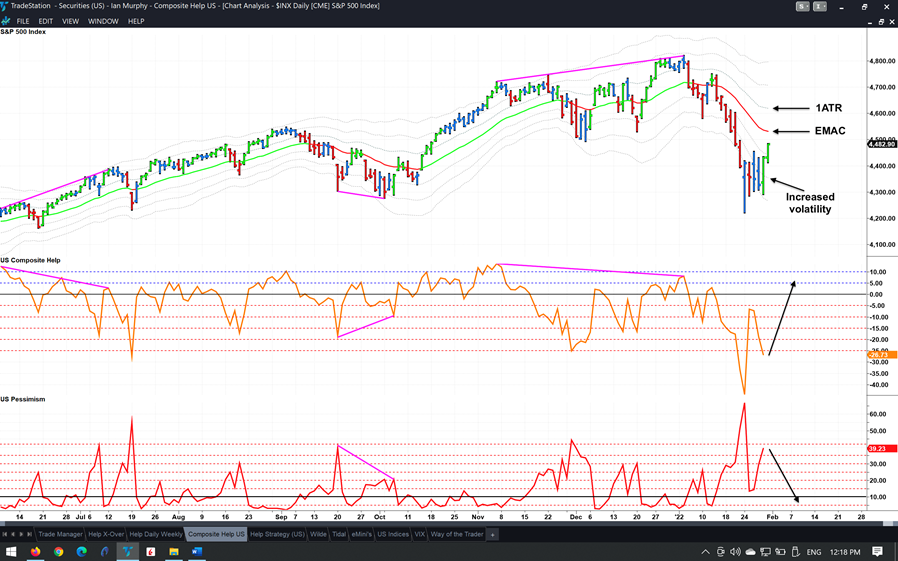
For the bull market to resume, the index needs to close above the moving average followed by the 1ATR line (marked). On the other hand, if we are in the early stages of a bear market, the index will fail to establish a foothold above these levels and will fall again forming a second lower high in the process. Also, Composite Help (orange line) and Pessimism (red line) will have to reverse course dramatically if this market is going to recover.
Help Strategy
In the meantime, a short-term swing trade will set up if the number of US stocks making new 20-day lows falls below 10%.
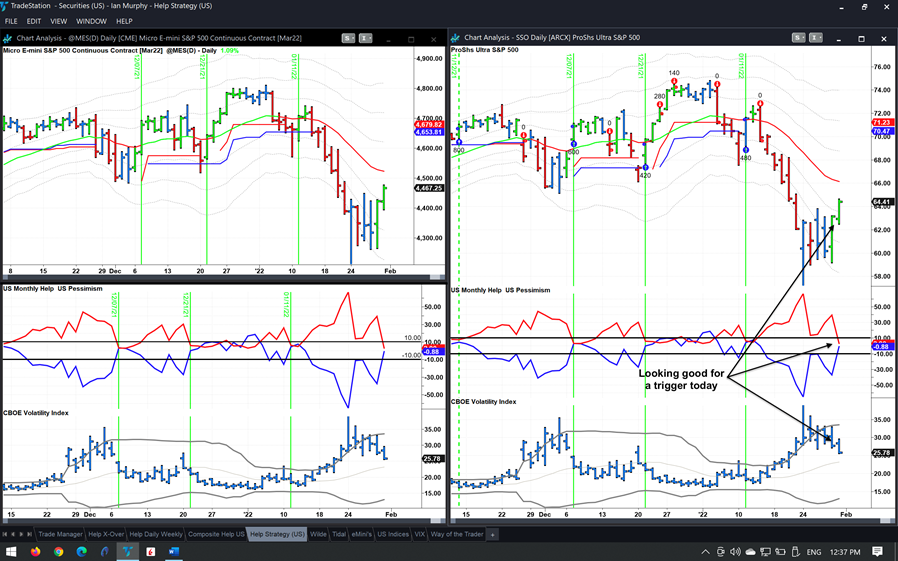
This would be the first Help trigger of 2022 and would follow in the heels of a false positive trigger on January 11, which was stopped out four days after the entry, but I closed out after two days in my personal account (red arrows above). As always, the decision to enter or not will be made about 15 minutes before the close of the regular session.
Website Updates
The Tidal Strategy is a long-term pure play on the US equity market, but technical signals are used to trigger entries and exits rather than economic fundamentals, so I call it ‘technical investing’. The current position in the popular S&P 500 ETF (SPY) has been open since June 2020, and the correction in the S&P500 offered an opportunity to update.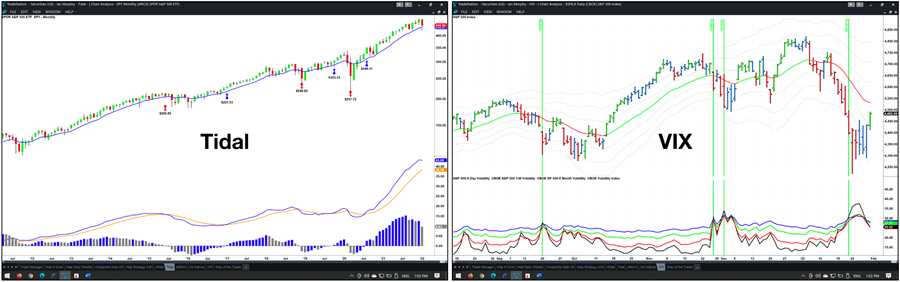
Learn More about Ian Murphey at MurphyTrading.com


