
The US Dollar is one market that continues to stand out as a stronghold for traders and investors, states Chris Vermeulen of The Technical Traders.
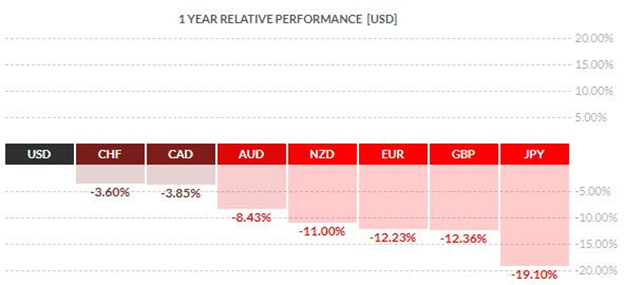
The world’s primary reserve currency, the USD (DX-Y.NYB), remains solidly above all other major global currencies.
As we move into the summer, the stock indices have not only been choppy but continue to trend lower.
Commodities, metals, and energy appear to be topping and experiencing distribution.
Cash is King as traders are now placing a value on liquidity. As losses mount and capital evaporates, traders are liquidating many different assets to meet margin calls and raise needed cash.
Going to cash and salvaging what is left is a survivalist strategy. It has many benefits providing peace of mind as well as the future potential to generate significant returns down the road. If a trader does nothing and their capital continues to evaporate, it can be fatal to a trader’s overall attitude and hinder their ability to generate future profits.
Markets go up, and markets go down. What makes the big difference is how we manage risk and how well we do in following the direction of price. Knowing and controlling one’s emotions dictates how long we can play the game or how successful we will be.
Now is not a good time for traders to become complacent or ignore their basic money management and risk principles.
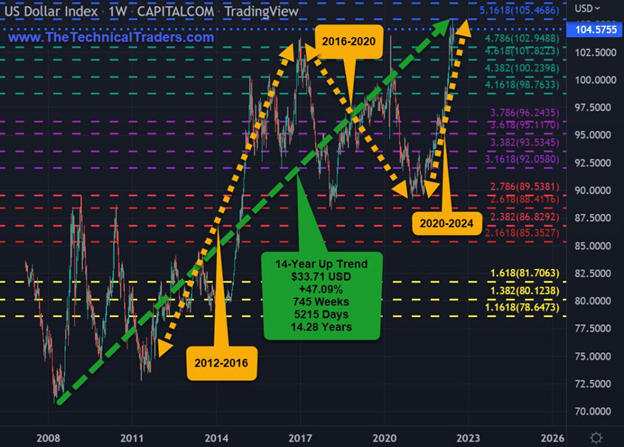
US Dollar 14-Year Uptrend
- US Dollar has been up 14.28 years from 2008 to 2022.
- 2012-2016 US Presidential Cycle: USD appreciated +37.20%.
- 2016-2020 US Presidential Cycle: USD depreciated – 12.80%.
- 2020-2022 US Presidential Cycle: USD appreciated +17.35% to date.
- US Dollar New 14-year high.
US DOLLAR INDEX • DXY • CAPITALCOM • WEEKLY
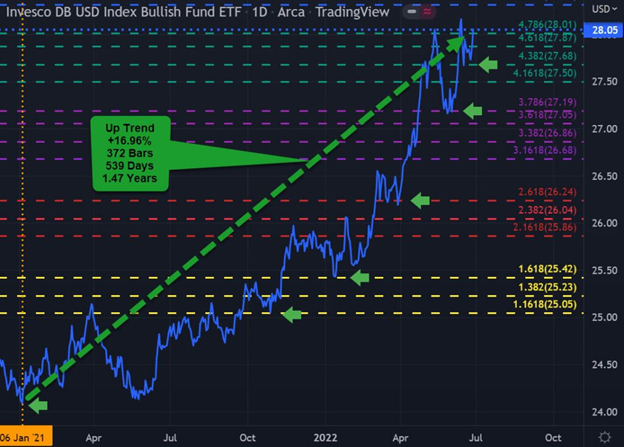
US Dollar ETF (UUP) +16.96%
- January 6, 2021, to present USD ETF UUP + 16.96%.
- Pullbacks or corrections have typically been 3-4%.
- Pullbacks or corrections have typically lasted 20-50 days.
- Price target extensions for potential resistance are at $36, $42, & $48.
INVESCO DB USD INDEX BULLISH FUND ETF • UUP • ARCA • DAILY
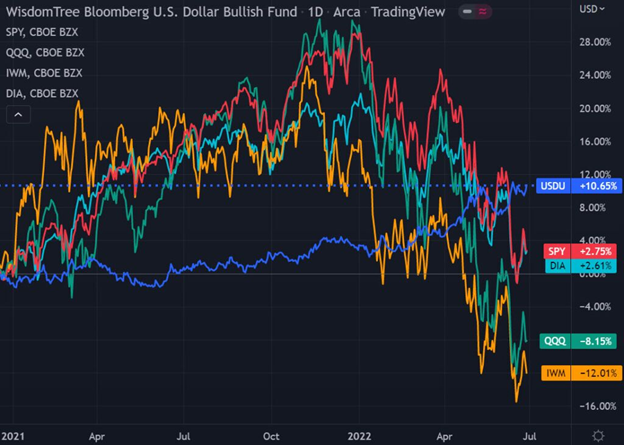
US Dollar VS US Equity Indices
- Comparative Percentage Chart: US Dollar ETF VS US Equity Indices ETFs.
- Timeframe: January 6, 2021, to present.
- 372 bars, 539 days, 77 weeks, 17.9 months, or 1.47 years.
- +10.65% USDU ETF: Wisdom Tree Bloomberg US Dollar Bullish Fund (USDU).
- +2.75% SPY ETF: S&P 500 (SPX).
- +2.61% DIA ETF: Dow Jones Industrial Average (DIA).
- -8.15% QQQ ETF: Nasdaq 100 (QQQ).
- -12.01% IWM ETF: Russell 2000 (IWM).
- Maximum spread equals 22.66% (+10.65% USDU vs -12.01% IWM).
- The forecast is that the spread will continue to expand.
WISDOM TREE BLOOMBERG US DOLLAR BULLISH FUND • USDU • ARCA • DAILY