

Something special happened for the bulls last week. For the greater part of 2022, any headlines that alluded to the Fed being more aggressive than the current mindset of the market were met with sell first, ask questions later, taking the major averages to fresh lows, explains Bryan Perry, editor of Cash Machine.
From the one-year chart below, there is a well-defined downtrend line that catches the previous top of the past two rally attempts to snap the bear trend, with each try failing to do so.
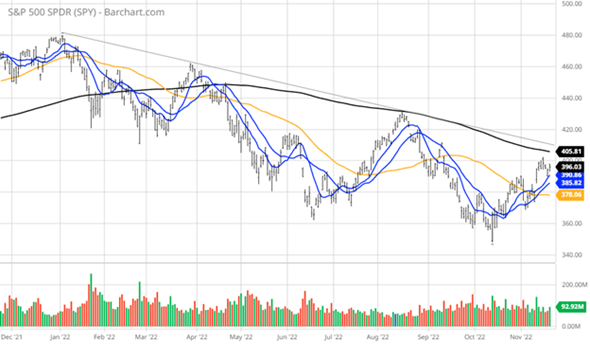
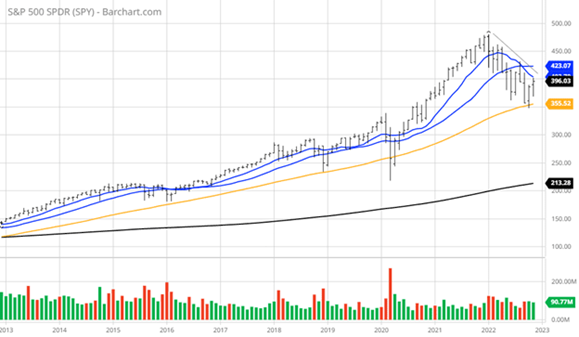
That downward-sloping straight line currently comes into play right at 4,100 for the S&P and is the next technical battleground for the bulls to take the high ground. Looking at the ten-year chart for the S&P, the 50-week moving average is still rising, with the index successfully testing this trendline at 3,500 and rebounding from there to 4,000, followed by some technical selling pressure and some very hawkish commentary by St. Louis Federal Reserve President James Bullard.
In that well-reported speech, Bullard cited the Taylor Rule in his new base case for the federal funds rate to reach as high as 7% to be “sufficiently restrictive” in combating inflation. Although Bullard didn’t throw out any numbers, his chart of the Policy Rate and Taylor-Type Rules’ Recommendations did all the talking.
This was brand new information for even most professional investors, quickly toggling up what the Taylor Rule is exactly. To be sure, it is a common rule of thumb that shows just how high the fed funds rate would need to be to create enough unemployment to bring the inflation rate back down to the targeted 2% level. The current annual inflation rate for the United States is 7.7% in October after rising to 8.2% in September. While one month doesn’t make for a trend, the market fully embraced the print, sending the S&P higher by over 7% in four sessions.
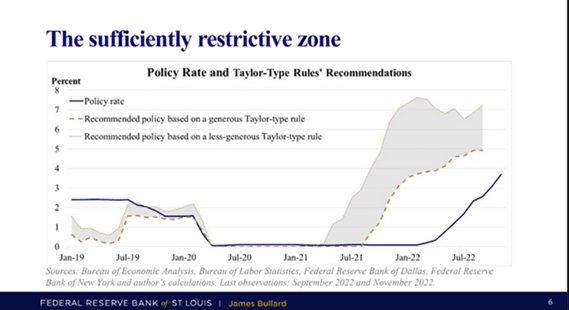
Bullard’s Chart: The gray area shows where policy ought to be, according to the Taylor Rule. The blue line shows where it is.
The fact that the S&P and, more impressively, the Nasdaq, didn’t fall through a trap door under the weight of Bullard’s comments was, in my opinion, remarkable. After rallying 10% off the CPI data, the Nasdaq gave back only 3% by last Friday against what would be considered a bombshell of so-called “Fedspeak” from someone who is considered by certain observers to be the second-most-influential Fed official behind Jerome Powell. Personally, I found the market’s ability to shake off this rhetoric to be very impressive.
This is where the market seems to be at a crossroads in terms of the outlook for the economy in the current quarter. If inflation ticks lower again in November, the health of the labor markets and commodity prices, specifically crude oil and the ongoing war in Ukraine, could take a turn for the better.
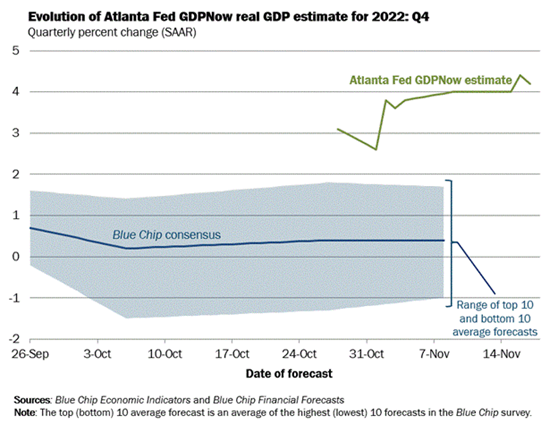
And then there is the all-important outlook for the fourth-quarter gross domestic product (GDP), which the Atlanta Fed has pegged at 4.2% in its latest estimate. That’s pretty good after five rate hikes, four of them of the jumbo variety at 75 bps each.
Since the Fed is determined to be data dependent, then, following the release of the Black Friday sales figures next Monday, Wall Street will be super-focused on the following:
November 30: Chicago Purchasing Manager Index (PMI) for November.
December first: Personal Consumption Expenditures Price Index (PCE) for October.
December second: Nonfarm Payrolls for November.
December ninth: Producer Price Index (PPI) for November.
December 13: Consumer Price Index (CPI) for November.
There are several other economic data points in between and leading up to the next Federal Open Market Committee (FOMC) meeting scheduled for Dec. 16, but these are the reports that will influence market sentiment the most. Until this parade of data points is released, it’s anyone’s guess whether last week’s bullish relative strength in the face of Fed adversity is a harbinger of good things to come. But the price action was encouraging, especially among a number of leading growth stocks, and that’s worth noting.
The market will likely pivot well before the Fed does, and this is where investors are hungry to see that inflection point where inflation data ebbs for a second straight month, the job market softens, bond yields remain off their recent highs, the dollar holds steady well off its highs and commodity prices don’t spike higher. Against this set of conditions, the S&P has a chance to take out resistance at 4,100.
It feels like investors sense that this could be a setup for an upside breakout since it is a seasonally good time to be long in stocks. A lot of what is outlined has to obviously go right for this scenario to play out, but the market seems to be buying into an economic slowdown versus a recession. And in this case, a year-end rally might be in the making as it would take a lot of people by surprise—especially those with a lot of cash.


