

A chart pattern is a visual representation of the actions of buyers and sellers in a market recorded in price action, says Steve Burns of New Trader U.
A chart is not predictive of the future but shows what is happening with buyers and sellers in the present moment. What it does is signal a higher probability of one path over another for price action based on momentum and the overall trend. The price action on a chart gives a trader signals about the current trend of a market and the path of least resistance.
Bullish chart patterns can show that a market is currently in an uptrend and is usually signaled by a breakout of resistance to a higher price. Bearish chart patterns can show that a market is currently in a downtrend and is usually signaled by a breakdown of the price below support to a lower price. A reversal chart pattern shows that a trend may be near its end and could be reversing.
Chart patterns are identified by connecting higher highs and higher lows for uptrends or lower lows and lower highs for downtrends to identify trendlines. The primary tool for identifying a chart pattern is trendlines. Different chart patterns identify different types of markets: sideways, uptrend, downtrend, and reversing.
The purpose of using chart patterns in trading is to identify current price action patterns and trade using signals to capitalize on the directional bias of price action. Trading price action using chart patterns is one of the simplest forms of technical analysis and reactive trend trading. Price is your guide and breakouts are your signals. Chart patterns can be used on different timeframes and in all types of market environments. Chart patterns break down and become ineffective in volatile markets when prices reverse back into the previous range. Chart patterns work best in markets that trend strongly after a breakout of a trading range. Chart patterns are technical tools for trading price action.
How many total chart patterns are there?
Chart pattern recognition can be subjective, however, there are also software programs for identifying the parameters and predefined rules that define historical chart patterns. According to the Encyclopedia of Chart Patterns, there are at least 53 recognized chart patterns. These chart patterns can be split into the categories of reversal patterns, continuation patterns, bilateral patterns, and harmonic patterns. Most of these patterns also have bearish and bullish versions depending on their directional bias, others are neutral before the breakout of a trendline.
Let’s take a look at the different categories of chart patterns that show the overall sentiment on a chart.
Reversal Chart Patterns
Reversal patterns happen when a chart has a strong break from its current trend and its momentum reverses course. These patterns show that a trend is coming to an end and that the price action is moving in a new direction away from the previous range and no longer following its previous directional bias. These patterns go from bullish to bearish or bearish to bullish. They can take longer to develop than other types of chart patterns as trends are slow to reverse most of the time as people have trouble accepting a change in course.
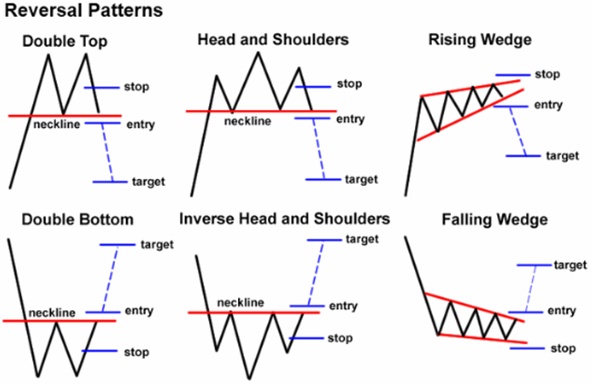
- Double Top
- Head and Shoulders top
- Rising Wedge
- Double Bottom
- Inverse Head and Shoulders
- Falling Wedge
Continuation Chart Patterns
Continuation patterns signal that the current trend is still in place and it’s about to resume going in the same direction after a trading range has formed. These types of patterns usually form consolidations in price action to let buyers and sellers work through supply and demand before moving higher or lower like the previous trend leading before the range. These are the most popular classic bearish and bullish chart patterns and are just waiting for zones before the previous trend resumes.
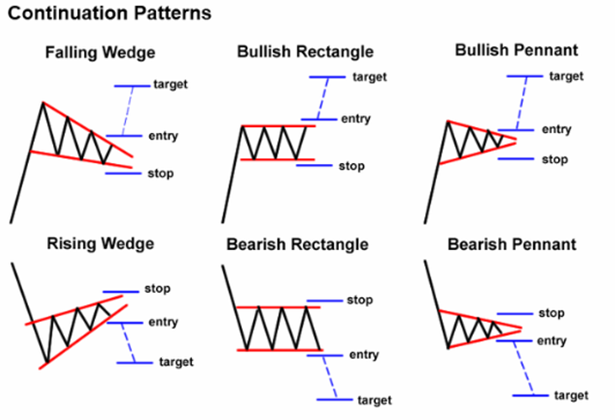
Falling Wedge
- Bullish Rectangle
- Bullish Pennant
- Rising Wedge
- Bearish Rectangle
- Bearish Pennant
Bilateral Chart Patterns
Bilateral patterns are neutral in movement and show that price can break out in either direction. These are usually symmetrical price action ranges that show equal support and resistance trend lines as the price consolidates. There is no advantage seen by the buyers or sellers as the upper trend line declines and the lower trend line ascends equally.
The previous trend in price before the triangle can many times also be unclear or has been a range as well. These types of charts are like Schrodinger’s patterns as they are both bullish and bearish until price breaks out in one direction showing which direction has an edge in the next trend. Most culminate in an apex before resolving in one direction, even the initial breakout can just start a new price action range without a big trend.
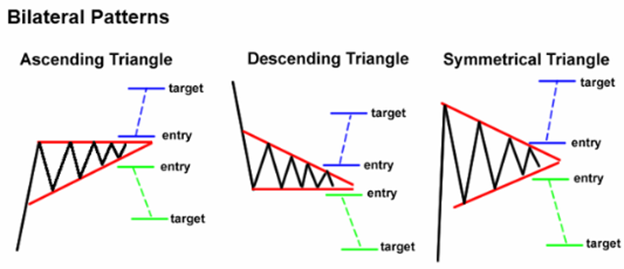
- Ascending Triangle
- Descending Triangle
- Symmetrical Triangle
Harmonic Patterns
Harmonic Patterns use the identification of quantified chart price action structures that have specific and consecutive Fibonacci ratio alignments that form the visual structures. Harmonic patterns calculate the Fibonacci levels of the price action patterns to identify high-probability reversal points on the charts. This method believes that harmonic patterns repeat on charts in cycles repeatedly. The key to using this trading strategy is to identify these patterns and to use them for creating good risk/reward ratio entries and to exit when a profit target is reached. Positions are taken based on the odds that the same historic patterns will repeat after entry.
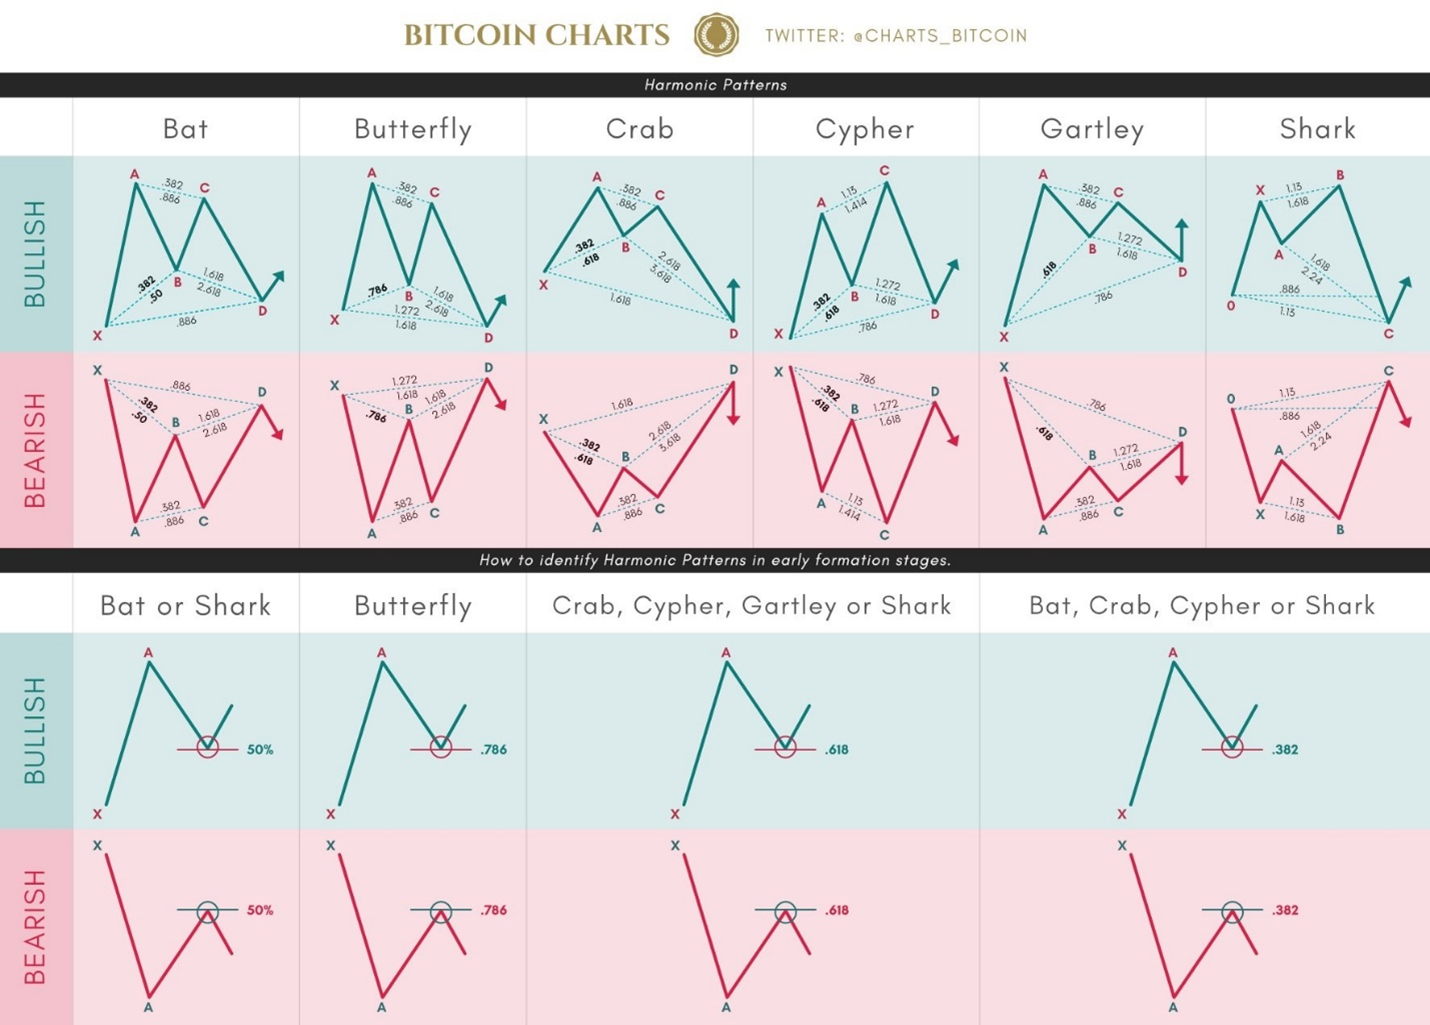
Here are the most common harmonic chart patterns:
- Bat
- Butterfly
- Gartley
- Cipher
- Crab
- Deep Crab
- Shark
- Three Drives
- AB=CD
- Five-Zero
Traders use the Potential Reversal Zone (PRZ) as the key level for support/resistance in their price action trading strategy.
Do Chart Patterns Fail?
Yes, patterns fail to play out many times other times they work well. When chart patterns fail traders simply take their stop loss and keep their losses small. When a chart pattern works and a swing, trend, or reversal in price occurs then a trader must maximize the win and let it run as far as possible. Nothing in life works every time, professional athletes don’t score on every attempt and neither does a trader regardless of their type of trading. Chart patterns can be profitable if you keep your losses small when they fail and maximize your gains when they work out well.
Do Chart Patterns Actually Work?
The edge in using chart patterns is that they identify the current path of least resistance of price action signaling you to trade in that direction. Chart patterns also give you the parameters for creating good risk/reward ratios through stop-loss levels and profit targets. The levels of entry, support, and resistance give you price zones to set your stop losses and profit targets. This is their primary value in technical analysis, to quantify levels for trading swings, trends, and reversals on a chart.
Saying that chart patterns don’t work is like saying Michael Jordan couldn’t shoot a basketball into a hoop because he didn’t have a 100% scoring rate. Chart patterns work over the long term when you use them to manage trades to create a positive expectancy due to the relationship between the win rate and the size of losses versus wins. A chart pattern is simply a technical strategy for identifying and profiting off directional momentum or an emerging trend. People that think chart patterns don’t work lack an understanding of how to use them.
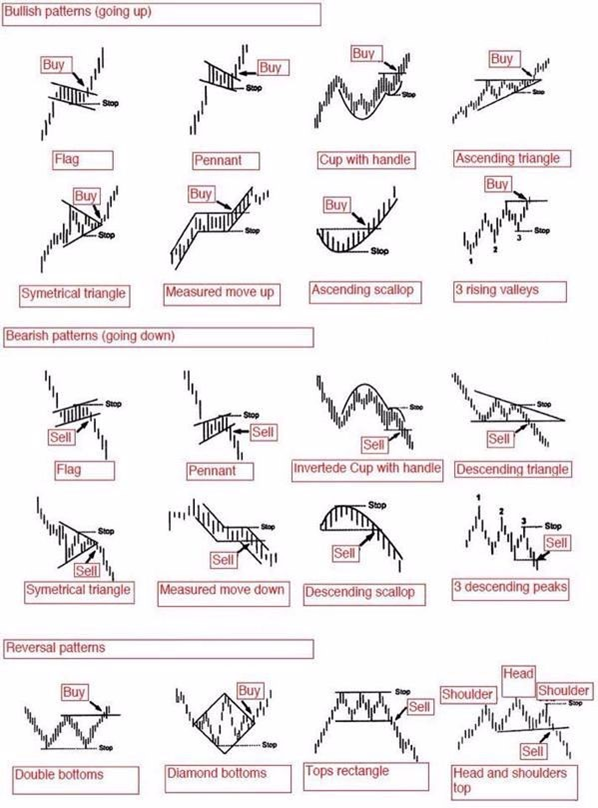
Pattern Guide Reading Strategy
This chart pattern strategy guide below shows the sentiment of each primary pattern along with the momentum breakout entry signal and stop loss area for trade management. Trailing stop losses can also be used to maximize gains while managing to keep open profits.
Learn more about Steve Burns at NewTraderU.com.


