

The chart of the day belongs to the specialized industrial equipment company Kadant (KAI), states Jim Van Meerten of BarChart.com.
I found the stock by using Barchart's powerful screening functions to find stocks with the highest technical buy signals, highest Weighted Alpha, superior current momentum, and having a Trend Seeker buy signal then used the Flipchart feature to review the charts for consistent price appreciation. Since the Trend Seeker signaled a buy on 8/30 the stock gained 5.74%.
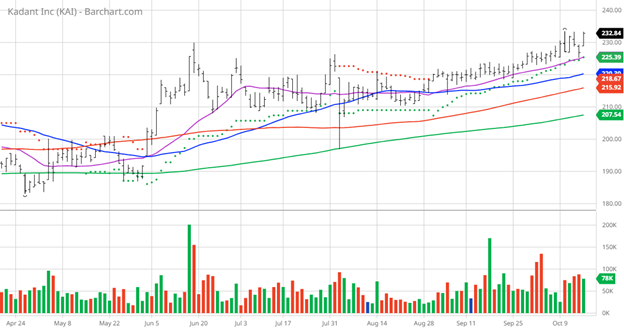
KAI Price vs Daily Moving Averages
Kadant Inc. supplies technologies and engineered systems worldwide. It operates through three segments: Flow Control, Industrial Processing, and Material Handling.
Barchart's Opinion Trading systems are listed below. Please note that the Barchart Opinion indicators are updated live during the session every 20 minutes and can therefore change during the day as the market fluctuates. The indicator numbers shown below therefore may not match what you see live on the Barchart.com website when you read this report.
Barchart Technical Indicators:
- 100% technical buy signals
- 37.80+ Weighted Alpha
- 41.99% gain in the last year
- Trend Seeker buy signal
- Above its 20, 50, and 100-day moving averages
- 8 new highs and up 5.41% in the last month
- Relative Strength Index 66.50%
- Technical support level at $225.02
- Recently traded at $232.84 with a 50-day moving average of $220.30
Fundamental Factors:
- Market Cap $2.66 billion
- P/E 23.77
- Dividend yield .50%
- Revenue is expected to grow 3.90% this year and another 3.80% next year
- Earnings are estimated to increase by .60% this year, an additional 5.60% next year, and continue compounding at an annual rate of 8.00% for the next five years
Analysts and Investor Sentiment—I don't buy stocks because everyone else is buying but I do realize that if major firms and investors are dumping a stock it's hard to make money swimming against the tide:
- Wall Street analysts gave one strong buy, one buy, and one hold opinion on the stock
- Analysts' price targets are between $205 and $243 with a consensus of $218—which is surprising because that is below today's closing and no one has a sell recommendation.
- The individual investors following the stock on Motley Fool voted 162 to 15 for the stock to beat the market with the more experienced investor voting 32 to one for the same result
- Value Line gives the stock its average rating of 3 with a price target of $244 for a 10% gain
- CFRAs MarketScope rates the stock a hold
- 1,400 investors monitor the stock on Seeking Alpha
Additional disclosure: The Barchart Chart of the Day highlights stocks that are experiencing exceptional current price appreciation. They are not intended to be buy recommendations as these stocks are extremely volatile and speculative. Should you decide to add one of these stocks to your investment portfolio it is highly suggested you follow a predetermined diversification and moving stop loss discipline that is consistent with your personal investment risk tolerance and reevaluate your stop losses at least every week.
On the date of publication, Jim Van Meerten did not have (either directly or indirectly) positions in any of the securities mentioned in this article. All information and data in this article is solely for informational purposes. For more information please view the Barchart Disclosure Policy.
Learn more about Jim Van Meerten at BarChart.com.


