

Indeed the stock market looks haunted this Halloween season as we continue to wallow under the 200-day moving average, states Steve Reitmeister of Reitmeister Total Return.
Sure, there are some positive sessions like we enjoyed kicking off this week. However, the overall mood is rather negative. This is all happening while recently soaring bond rates have leveled off. So why is the mood still so dower? And will that keep the Santa Claus rally away this year?
Bond Rates Up > Stock Prices Down
This has been the equation that explained most of the downfall for stocks over the past couple of months. The more benign version of that story was that rates were normalizing to more traditional historical levels versus the ultra-low manipulated levels we have enjoyed the past 2 decades.
The more sinister version of that rate-rising story was that perhaps investors were losing confidence in major world governments to pay back that UNSEEMLY debt burdens. This is what some call the Debt Supercycle which would be a painful debt crisis (picture the Greek debt problem and make it 50X worse).
Ten-year Treasury rates did briefly touch 5% back on 10/18. That has seemed to be a place of resistance with rates settling under that mark ever since.
So Why Have Stocks Not Been More Robust with This Bond Rate Reprieve?
First, the concern is that like any long-term rally, there are runs higher followed by pauses/pullbacks/corrections, and then the next run higher. Meaning that just because rates ran out of steam around 5% at this time doesn’t mean they won’t run higher down the road. Thus, investors are likely in wait-and-see mode to appreciate what happens next.
Also, this rising of rates has many investors predicting a great softening of the economy from a fairly overheated +4.9% pace in Q3. That is why the key economic reports this week will have a market-moving impact. I am referring to ISM Manufacturing on 11/1 followed by Government Employment and ISM Services on 11/3.
Certainly, you can throw the 11/1 Fed meeting into the mix as an important event to watch. But right now, investors are dead certain they will sit on their hands once again.
The key, as usual, will be Powell’s comments that will give us a sense of their future rate plans. Also of interest will be if there are any comments about higher rates, outside of their efforts, is doing some of the hard work to further soften the economy in the quest to finally tame high inflation.
Back to the economic reports for a second. Yes, ISM Manufacturing leads the parade on Wednesday. However, on Tuesday we got served up the best leading indicator for that report in the Chicago PMI which stayed very low at 44 (under 50 = contraction).
This likely points to a subdued ISM Manufacturing report to jump-start November. The key is how soft. If it just comes in a notch under 50 then some investors may celebrate that as a sign the economy is moderating from the too-hot pace set in Q3...and this would be good for moderating inflation and allowing the Fed to lower rates sooner.
However, if we have a reading greatly lower than the previous 49...then it could raise fears of a recession forming...and that most certainly would not be good for stocks.
Let’s also consider what is happening this earnings season as we are at the midpoint. Right now it seems quite similar to other recent quarters. That means companies have been beating low expectations which shows up with the rise of earnings growth for the current quarter.
Before you celebrate, cast your eyes on the 3 columns to the right where earnings estimates are getting cut for the future. And overall, no real earnings growth is expected til Q2.
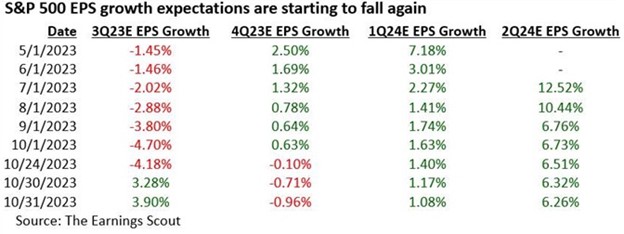
Since the expectations for future earnings growth are the main catalyst for stock price appreciation...then you can appreciate why the market has been in correction mode. That is why the maker of this earnings chart, Nick Raich of Earnings Scout, is recommending that folks stay underweight stocks at this time until we see earnings revisions turn positive.
Price Action & Trading Plan
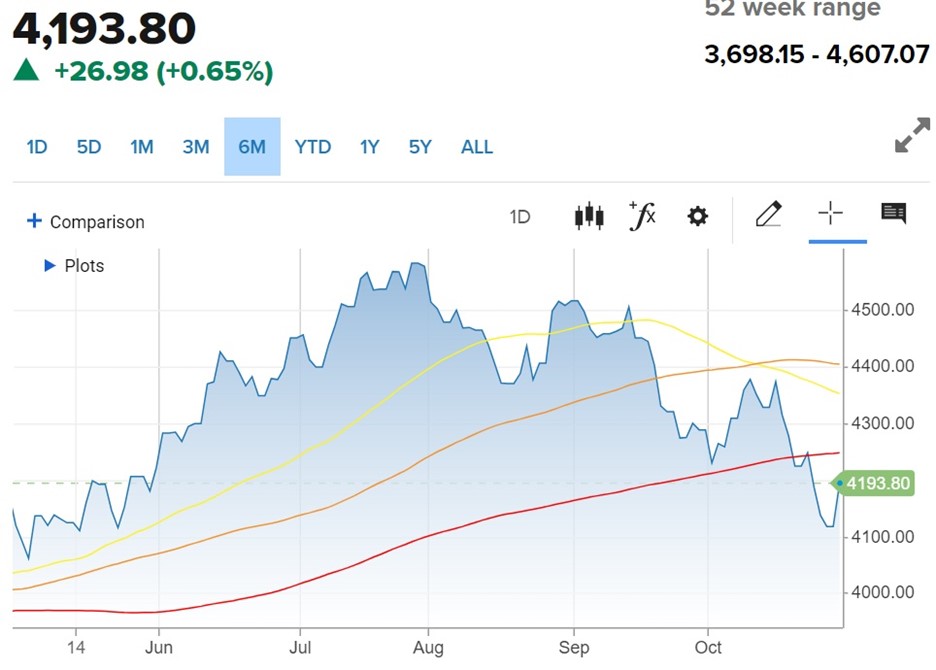
Moving Averages: 50 Day (yellow), 100 Day (orange), 200 Day (red)
No way to see the above and feel good about the market being below all 3 key trend lines. Especially bad when things break below the 200-day moving average (4,242) which took place a week ago. Honestly, I don’t sense a lot more downside on the way given the current facts in hand. Rather, I just see us consolidating under the 200 moving average for a while as investors await more facts on what lies ahead. Unfortunately, I also don’t see much reason to break back higher until investors are more convinced that the advancement of rates has ended and thus odds of a future recession remain low.
Learn More About Reitmeister Total Return here…


