

The correction from the early June highs to the lows of last week was about 5% for the S&P 500 Index (^SPX). That was enough to at least temporarily remove the “bullish” designation from the SPX chart, explains Lawrence McMillan, editor of Option Strategist.
The index fell below its 20-day moving average, and there is resistance in the 7,500-7,520 area. A rise back above that area might be enough to restore the bullish scenario, but for now, the index is in a short-term negative trend.
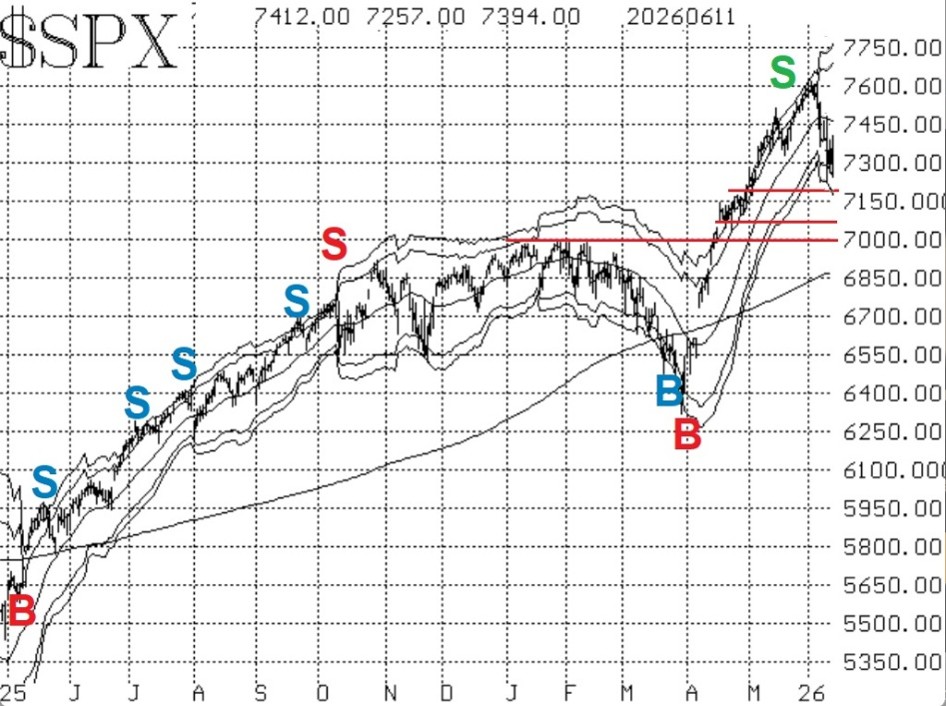
There is support at last week's lows, or 7,237. Furthermore, there is a stronger support area in the 7,050-7,175 range, where SPX traded in the latter half of April. Finally, there is major support at 7,000, which had been resistance all during January and February. A decline below 7,000 would be very negative for the chart and for stocks in general.
Equity-only put-call ratios have risen as this volatility has unfolded. The number of puts being purchased is on the rise, and that forces the ratios higher. As long as the ratios are climbing, they are on sell signals for the stock market.
Breadth has been a bit unusual. NYSE breadth has been far superior to “stocks only” breadth recently. As a result, the breadth oscillators are mixed and not giving a clear signal at this time.
In summary, the SPX chart is no longer positive, but continue to roll deeply in-the-money options where appropriate.


