

Our model shows that gold tends to trend opposite to real yields (the yield on TIPS) over long periods. One explanation is that gold pays no interest or dividend, so the real yield is the opportunity cost of owning it. Still, liquidity explains divergences from the trend, writes Lance Roberts, editor of the Bull Bear Report.
A reader recently asked: “You have said many times that gold has a strong negative correlation with real yields. If that is true, why did precious metals get hammered (last Friday) when yields were lower on the day?”
My answer: When real yields rise, gold often struggles. When they fall, gold tends to do well. From 2003 through 2021, the correlation between the two was negative 0.84.
Second, real yields indicate Federal Reserve policy. When they are high, as they are today, it signals that the Fed is running a restrictive policy to combat inflation. Conversely, when low or even negative, real yields signal policy that is too easy and inflationary.
Many people buy gold to hedge against inflation. Thus, Fed policy is crucial to that decision.
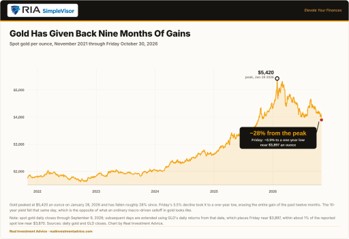
Gold did rally despite high real yields in 2024 and 2025 as central bank buying and geopolitics overwhelmed the traditional correlation. But as real rates kept climbing, the negative correlation reasserted itself.
All that said, Friday was an important lesson for gold investors. Friday was a liquidity story.
The Nasdaq fell 2.8% on doubts about AI spending. Leveraged investors facing margin calls do not always sell what they want to sell. They sell what is most liquid. Gold is among the most liquid assets in the world and among the best collateral, so it often gets sold first. Bear in mind, last Friday was month-end, when liquidity is often compromised to some degree.
The takeaway: Real yields explain Fed policy and thus heavily impact gold trends over years. But liquidity explains divergences from the trend. An asset you may consider insurance may also be somebody else’s margin call.