

Current market momentum is mixed. To make calls on momentum, we look at several factors, including stocks trading above or below key trendlines, highs and lows, and indices versus moving averages, advises John Eade, president of Argus Research.
Currently, 58% of stocks are trading above their 20-day moving averages, above the demarcation level of 50%. This short-term technical metric has been in a bullish pattern of higher highs and higher lows following a recent bearish low of 26% in September 2026.
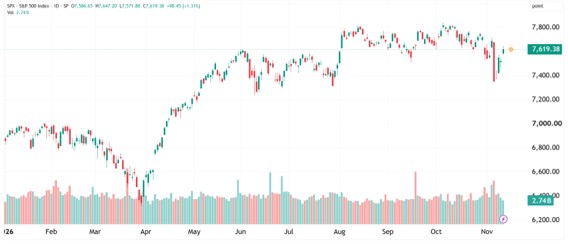
S&P 500 Index (SPX)
Source: TradingView
Considering the renewed momentum, there is room for further upward movement given the one-year high of 83%. Meanwhile, longer-term trends are less bullish. Some 44% of stocks are trading above their 100-day moving averages, which is below the positive line. The metric last bottomed near 31% in October 2026 and, despite a pullback last week, has been in a mostly bullish pattern since then.
There is ample headroom before the ceiling given the five-year high of 79%. From a longer-term technical perspective, the percentage of stocks above their 200-day trend-line is also below the demarcation level; the current reading is 47%.
Following a low in October this year, the trend has maintained a short-term bullish pattern of higher highs and higher lows. This metric remains well above a low of 14% in April 2025, but still has a long way to go before it nears the five-year high of 72%.
Turning to the indices, the S&P 500 Index (^SPX) remains above its 200-day moving average of 7,334. The slope of the trendline is also positive, another bullish indicator.