

Just over a week ago, the Nasdaq Composite Index was down 5.5% on the day and in correction territory, the S&P 500 Index (^SPX) was off 4.4%, and the CBOE Volatility Index (^VIX) was nearing 30. The bounce off the Nov. 5 low is constructive, but it needs to hold, says Jeff Hirsch, editor-in-chief of The Stock Trader’s Almanac.
Our updated Seasonal Patterns charts show 2026 is still tracking 2018, President Trump’s first midterm year. In 2018, the market bounced after the midterms, faded into late November, rallied briefly in early December, then slid into the Christmas Eve low.
(Editor’s Note: Jeff will be speaking at the 2026 MoneyShow Masters Symposium Sarasota, scheduled for Nov. 30 – Dec. 2. Click HERE to register.)
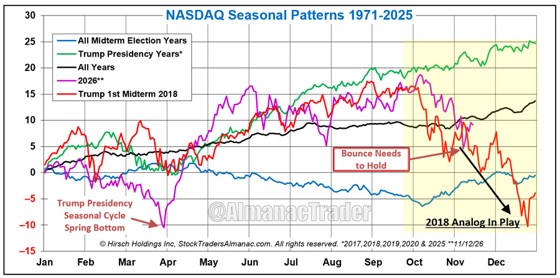
The setup is the same this year: A post-election reversal followed by a relief bounce. What comes next decides whether 2026 keeps following 2018 down or breaks away from it. This week is the week before Thanksgiving and Nvidia Corp. (NVDA) reports earnings tomorrow, so the bounce is likely to be tested quickly.
Still, the key levels held. The S&P 500 tested its 200-day moving average, now 7,337, and bounced. It then reclaimed the 7,550 area, the June–July highs and August breakout level. Resistance is the 50-day moving average at 7,671.
The Nasdaq undercut its 200-day moving average, but held above 24,000 support. Resistance is 26,000, then the 50-day at 26,379. MACD has turned up from oversold on both indexes.