
Click
to Enlarge
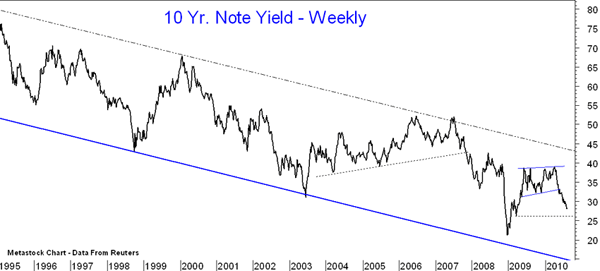
The majority of stock market traders and investors are waiting for the Fed’s announcement later today as even subtle changes in the wording may give us clues about current and upcoming monetary policy. The chart of the ten-year Treasury yield shows a well-defined trading channel that goes back over 15 years. The violation of support at 3.3% in mid May signaled the recent decline with next support in the 2.62% area. A drop back to the 2008 lows would likely spur another financial panic.
Tom Aspray, professional trader and analyst, serves as video content editor for MoneyShow.com. The views expressed here are his own.


