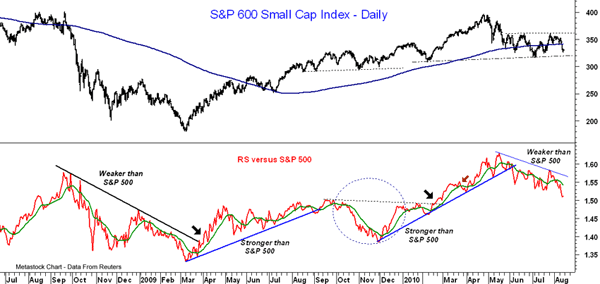
This chart of the S&P 600 Small Cap Index goes back to the middle of 2008 and the RS plot compares its performance to that of the S&P 500. For most of the bear market, the S&P 600 was weaker, but that changed in April 2009. The uptrend in the RS was broken in October 2009 as the small caps underperformed for two months before breaking out early this year. This could be similar to our current situation as the S&P 600 has been weaker since May, and if this is just a correction, the support at 300-310 needs to hold.
Tom Aspray, professional trader and analyst, serves as video content editor for MoneyShow.com. The views expressed here are his own.


