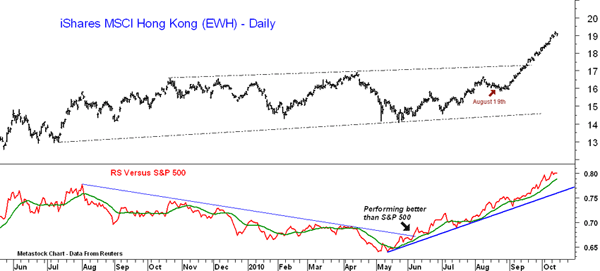
As discussed on August 19, the iShares MSCI Hong Kong ETF (EWH) started to outperform the S&P 500 on June 7 when the downtrend in the relative strength (RS) was broken. The RS line on the bottom of the chart compares the performance of EWH to the S&P 500, and when it turns positive, it indicates that EWH should perform better than the S&P. Since June 7, EWH is up 31.9%, while the S&P is up just 11.7%. Both the chart and RS analysis on EWH continue to look strong.
Tom Aspray, professional trader and analyst, serves as video content editor for MoneyShow.com. The views expressed here are his own.


