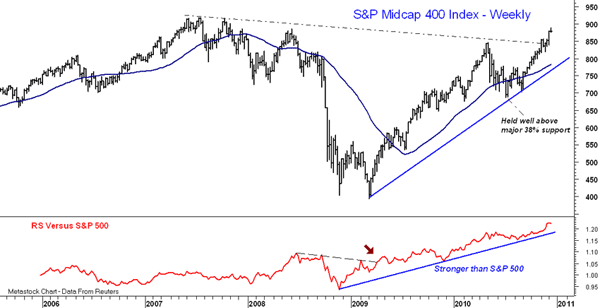
The weekly chart of the S&P 400 Midcap Index shows that the resistance from the 2007 highs has been decisively overcome. This was longer-term resistance and the S&P 400 should now find good support at the April highs in the 850 area. The relative performance analysis versus the S&P 500 is often featured in both our daily charts and bi-weekly Trading Lessons, and if you are buying individual stocks, relative performance should be part of your analysis. It compares the performance of a stock or a major average to the S&P 500 and can help you find the strongest stocks or sectors. The S&P 400 has been outperforming the S&P 500 since the 2009 lows, up 117% versus 80% for the S&P 500.
Tom Aspray, professional trader and analyst, serves as video content editor for MoneyShow.com. The views expressed here are his own.


