
Traders and investors can gain a keen perspective on long-term trends for major stock indices and key commodities like gold and oil by stepping back to the yearly time frame.
As we end 2011, most investors and analysts are looking ahead into 2012 in an effort to position their portfolios for the coming year. Though I mostly concentrate on the monthly, weekly, and daily charts, I have also found it helpful to examine quarterly and yearly time frames.
From the yearly charts, we can find some valuable information that can be used not only to gain perspective for the year ahead, but also to identify some key support and resistance levels for 2012.
Click to Enlarge
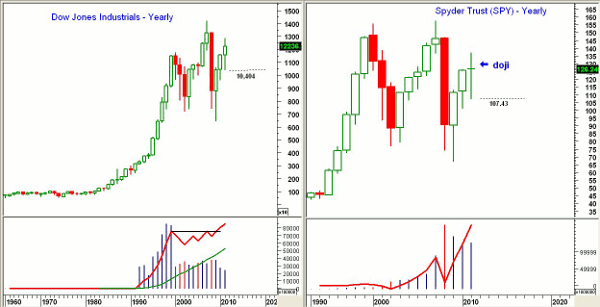
Chart Analysis: The yearly chart of the Dow Jones Industrials, which I use to confirm my analysis of the SPDR Diamond Trust (DIA), shows that this will be the third consecutive higher yearly close.
- The yearly support is now at 10,404, so a break of this level in 2012 would be quite negative
- There is monthly resistance at 12,876. For DIA, support is at $103.84 with resistance at $128.63
- Though the volume has declined over the past three years, the on-balance volume (OBV) broke through resistance (line a) in 2009, which was a positive sign
The yearly chart of the Spyder Trust (SPY) does not look nearly as positive as the chart of the Dow.
- The yearly chart will form a doji this year, which indicates indecision during 2011
- Key yearly support is now at $107.43. A yearly close below this level in 2012 would be negative
- There is important yearly resistance at $137.18, which is a key level to watch for the coming year. There is even stronger resistance from the 2010 high at $146.99
- Yearly OBV looks strong and will make new highs. The OBV on the E-mini S&P futures did not make a new high this year
- The long-term chart seasonal analysis of the stock market shows that stocks typically bottom in November and top in May
NEXT: Yearly Trends for Gold and Crude Oil |pagebreak|
Click to Enlarge
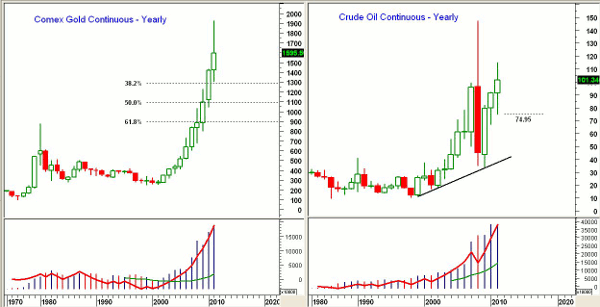
The yearly chart of the Comex Gold futures can give an excellent long-term view of the SPDR Gold Trust (GLD), which does not have as much trading history.
- The yearly chart shows the 1980 high and emphasizes the wide range in 2011 with a high of $1923.75 and a low of $1307.70
- There is also yearly support at the opening level of $1422
- Major 38.2% Fibonacci retracement support lies at $1285
- For GLD, the yearly high was $185.85 and the low was $127.80
- Volume for the year made a new high in 2011, as did the OBV
- OBV moved above its weighted moving average (WMA) in 2004
- Seasonal analysis going back 20 years shows that gold typically tops in February
The crude oil market has had a nice correlation with the stock market in 2011, and I believe oil will still be a key market to watch in 2012. Crude oil, basis the continuous contract, has closed higher for the past three years.
- There is yearly resistance for 2012 at $114.83
- The opening level for 2011 at $91.31 is the first level of support. Yearly lows are at $74.95.
- Volume in 2011 was just slightly less than in 2010, but the OBV looks strong and made new highs this year
- Monthly OBV (not shown) confirmed the May highs and is now very close to the May 2011 highs
- The long-term seasonal analysis for crude shows that it typically bottoms in February and tops in July
What It Means: The yearly analysis of the stock market is still positive, while the weekly analysis needs a strong close above the November highs to keep the intermediate-term trend positive.
The decline in gold from the September highs has dampened the bullish sentiment, and as I mentioned earlier this week, I think gold is close to bottoming.
Currently, crude oil looks strong and is likely to move higher in the early part of 2012.
How to Profit: Traders and investors should note the yearly support and resistance levels for these four key markets and watch them closely as next year progresses.


