
With the seasonal pattern in crude oil traditionally peaking in August, MoneyShow’s Tom Aspray take a technical look at this commodity and stocks associated with it.
Tuesday’s early rally in the stock market lost some steam as the day progressed with the Dow Industrials actually closing a bit lower. The market internals were 2-1 positive as the McClellan oscillator rose from -295 Monday to close Tuesday at -174.
Typically, with this type of oversold reading with prices at the daily starc- bands, I would expect to see prices rebound for more than one day before the selling resumed. The futures are lower in early trading as the market nervously awaits the release of the FOMC meeting notes this afternoon.
Interest rates declined a bit, which took some of the pressure off many of the high-yield instruments that have been getting hit hard lately. Crude oil was under sharp selling pressure as the September contract expired 2% lower, which was the largest decline since June 20.
Crude oil traders are now waiting for this morning’s survey from the EAI as a 1.3-million drop in inventories is expected. A rise in inventories could put additional pressure on crude oil prices. So what does that mean for stock prices and what about the energy sector?
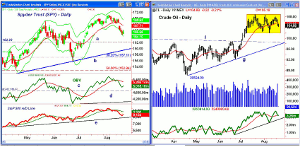
Click
to Enlarge
Chart Analysis: The Spyder Trust (SPY) has tested its daily starc- band for three of the past four days as prices stabilized Tuesday.
- The monthly pivot is at $166.26 with further resistance at $167 and then the declining 20-day EMA at $167.71.
- The daily OBV has turned up and is well below its declining WMA.
- The OBV has further support at line c, and then the long-term uptrend, line d.
- The S&P 500 Advance/Decline line dropped below its WMA on August 12.
- The A/D line has turned up as it has held so far well above the longer-term support at line e.
- There is next support at $162.23 with the weekly starc- band at $160.19.
- The daily uptrend, line b, is at $159.36.
- The 38.2% Fibonacci retracement support from the Nov. 2012 low is at $157.11, which is just above the June lows.
The daily chart of crude oil shows the trading range that has been in effect since July with resistance at $109 and support at $101.82.
- The lower boundary of this range is 2.7% below current levels as crude is down 0.20% in early trading.
- A break of this support would make the next downside targets the converging support in the $97.40-$98.40 (lines f and g).
- Volume did pick up yesterday and the OBV is now testing its flat WMA, which may mean the correction is over.
- The weekly OBV (not shown) is above its WMA and therefore positive.
- There is minor support at $105.52 and the flat 20-day EMA with further at $107.
- An upside breakout from the trading range would give upside targets in the $114-$116 area.
NEXT PAGE: What It Means
|pagebreak|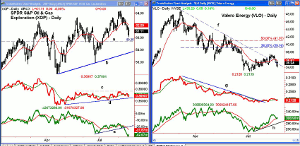
Click
to Enlarge
The daily chart of the S&P Oil and Gas Exploration ETF (XOP) shows that it made new highs in July as did the S&P Energy Index.
- XOP dropped below its 20-day EMA on August 14 and hit a low Tuesday of $60.18 before closing higher.
- There is further support now at $59.35 with the quarterly pivot at $58.65.
- The daily uptrend that connects the April and June lows, line b, is at $57.46.
- The relative performance still shows a gradual uptrend, line d.
- The RS line needs to break out above the resistance at line c to signal it is a market leader.
- The OBV broke its uptrend, line e, over a week ago and has plunged to new lows.
- This is a negative indication but the weekly OBV (not shown) does look better.
- There is initial resistance now in the $62.20 area.
Valero Energy Corp. (VLO) rallied in early August but failed to move above the quarterly pivot at $37.88 before turning lower. It did manage to stabilize Tuesday after a three-day slide.
- The rally was strong enough to break the daily downtrend, which was an indication that the correction from the April highs may be over.
- The relative performance also broke its downtrend, line g, in late July.
- The daily OBV formed a positive divergence at the early July lows before moving above its WMA.
- The OBV has been acting stronger than prices as it turned up Tuesday after testing its rising WMA.
- The weekly OBV (not shown) is still slightly below its WMA.
- There is first resistance at $35.80 and then at $37.05.
- The 38.2% Fibonacci retracement resistance is at $39.16 with the 50% level at $41.07.
What It Means: Both crude oil and the futures are slightly lower in early trading. If stocks can close higher today, it will further relieve the short-term oversold readings from many of the technical studies.
A higher close in stocks could set up a short-term buying opportunity in the inverse ETFs, and stocks should then see a further decline. The market needs a sharper drop and more ‘taper tantrums” to increase the bearish sentiment enough to create a good buying opportunity.
The longer-term outlook for crude oil is positive after its breakout in July, and it may still turn out to be a market-leading sector in the 4th quarter.
How to Profit: Now new recommendation for now.
Portfolio Update: For Valero Energy Corp., (VLO) should be 50% long at $34.90 and 50% long at $34.11, use a stop at $33.87.
For Phillips 66 (PSX), should be 50% long at $56.64 and 50% long at $55.44, with a stop at $54.39.
For EPL Oil & Gas Inc. (EPL), missed the buy level at $29.86 by a penny and would cancel the order.
NEXT PAGE: The Charts in Play Portfolio
|pagebreak|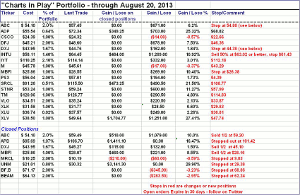
Click
to Enlarge


