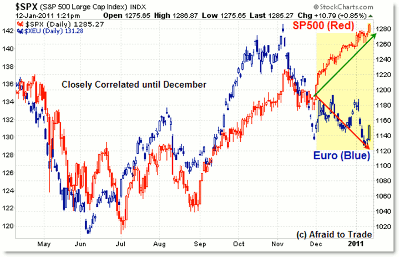
I wanted to make a quick observation and point out the chart of the temporary December decoupling of the US S&P 500 Index and the Euro Index, which has in the past enjoyed a strong positive correlation.
Let’s take a look and see what may be important factors to watch:
With the exception of the period just before May 2010’s “flash crash,” the Euro Index and the S&P 500 have enjoyed a close positive relationship.
That makes sense, as the US Dollar Index—often strongly the inverse of the Euro Index—has been strongly negatively correlated most of the time to the S&P 500.
However, as we see above, there’s more to monitoring intermarket relationships (stocks and currencies, for example) than just “Observe them and forget them.”
Cross-market relationships, while steady over time, do experience little bumps and shakes and minor decouplings along the way.
Such is the case through December 2010, when stocks (in red) continued their powerful uptrend off the September lows, while the euro, which had enjoyed a strong rally until November (peaking alongside stocks), decoupled and traded lower.
From a technical standpoint, the euro faces a key test of support at the 129/128 level as a potential double bottom forms. A breakdown under 128 would be a bearish breakdown/downtrend continuation signal for the euro, so be sure to watch that level closely.
So far—and today is just one day in the market cycle—the euro and stocks have rejoined as both are up strongly on January 12. Watch to see if the positive relationship is re-established in January.
The overarching factor in both cases where the euro briefly decoupled with stocks was due in large part to the sovereign debt crisis and potential/pending/real bailouts of countries (Greece, Ireland, and talks of Portugal and Spain now).
Those factors have hammered the euro (relative to the US dollar index and other currencies) while investors feared financial contagion, accounting largely for the temporary switches in otherwise strongly correlated situations.
Anyway, it’s a lesson in constantly monitoring any hedged positions based on an ongoing intermarket thesis (long this, short that, etc.).
Relationships can (and do) change, though usually due to large-scale headline news events you can monitor alongside price on the charts.
By Corey Rosenbloom, trader and blogger, AfraidToTrade.com


