With a proven bearish pattern unfolding in the EUR/USD currency pair, here are the important price levels that would confirm or invalidate this set-up, as well as where to enter, place a stop, and take profits.
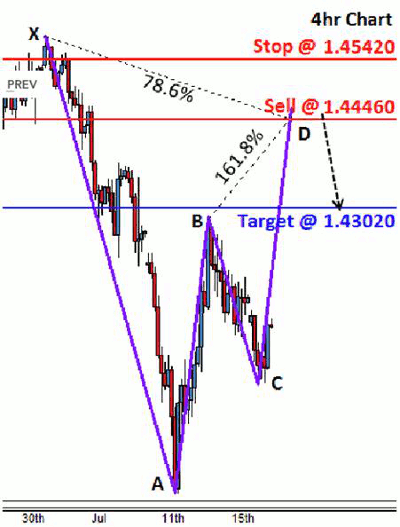
A bearish Gartley pattern is emerging on the EUR/USD four-hour chart. The pattern is relatively solid, but it has a long way to rise since it is still near point C on the below chart.
For proper time symmetry, we would like the CD leg to rise with a similar slope to the AB leg.
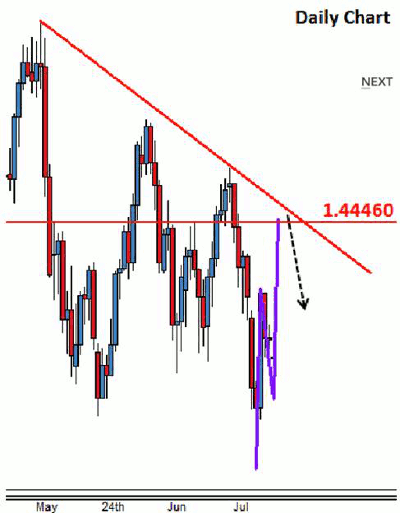
The trade idea would also enter near the bearish trend line on the daily chart. However, the trade idea is invalidated if the pair drops to 1.3993 before reaching our entry.
The Gartley pattern could be confirmed by a resistance line drawn on the daily chart, which makes this pattern of particular interest.
So, the potential trade is:
- Sell EUR/USD at 1.4446
- Stop at 1.4542
- Profit target at 1.4302
By Bradley W. Gareiss, technical analyst, FX360.com


